Transformation of AA to PGH2 (COX-1)
The COX enzyme possesses two isoforms, COX-1 and COX-2, of which both produce bioactive eicosanoids. The two isoforms have nearly identical active site residues (Simmons et al. 2004), but COX-1 is a constitutive enzyme, whereas COX-2 is an inducible enzyme. Both enzymes add molecular oxygen to arachidonic acid, generating an endoperoxide species, PGH2, by catalysing the two-step reaction of cycloooxygenation and oxygenation, followed by a hydroperoxide reduction.
PGH2 possesses a short life time due to the formation of a reactive functional group. The endoperoxide undergoes rapid isomerisation reactions, catalysed by a series of synthase enzymes (PGES, PGDS, PGIS, PGFS and TXAS). The resultant species of the isomerisation reactions are PGs (PGE2, PGD2, PGJ2, deoxy-PGJ2 and PGF2α), TXs (TXA2 and TXB2) and prostacyclin (PGI2), all of which have varying effects on the immune system.
Contents
Reaction
Chemical equation

Rate equation
Enzyme Parameters
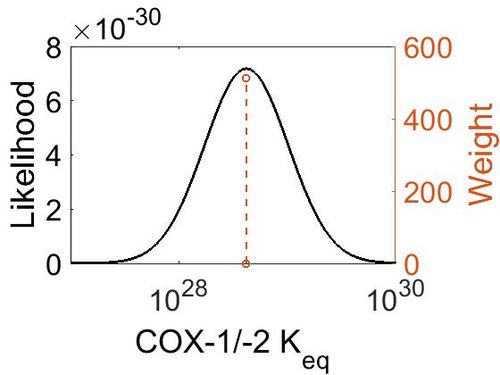
Keq
| Value | Units | Species | Notes | Reference |
|---|---|---|---|---|
| (-30) | kcal/mol | Unspecified | Calculations with a Gaussian98 suite of programs
Enzyme: COX (Unspecific) Substrate: Arachidonate Temperature: 298.15 K Pressure: 1 bar |
[1] |
| Mode | Confidence Interval | Location parameter (µ) | Scale parameter (σ) |
|---|---|---|---|
| 4.18E+28 | 1.00E+01 | 6.67E+01 | 8.90E-01 |
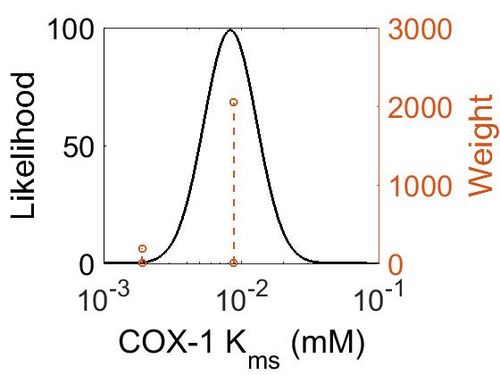
Kms
| Value | Units | Species | Notes | Reference |
|---|---|---|---|---|
| 0.0088 ± 0.0022 | 
|
Human | Expression Vector: Human
Enzyme: Cyclooxygenase-1 pH: 7.6 - 8.4 Temperature: 37 °C |
[2] |
| 0.0019 ± 0.0002 | 
|
Ram | Expression Vector: Ram
Enzyme: Cyclooxygenase-1 pH: 8 Temperature: 30 ± 0.2 °C |
[3] |
| Mode | Confidence Interval | Location parameter (µ) | Scale parameter (σ) |
|---|---|---|---|
| 8.30E-03 | 1.62E+00 | -4.60E+00 | 4.41E-01 |
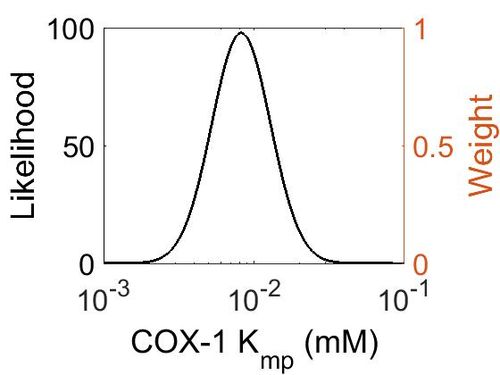
Kmp
| Mode (mM) | Location parameter (μ) | Scale parameter (σ) |
|---|---|---|
| 8.20E-03 | -4.60E+00 | 4.49E-01 |
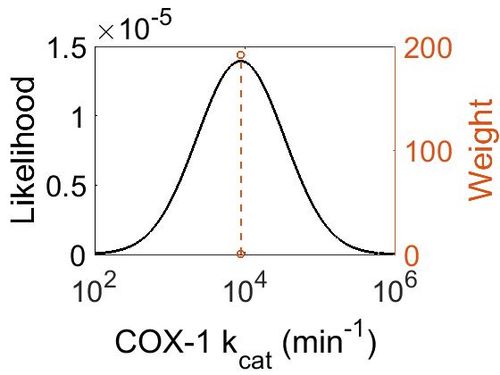
kcat
| Value | Units | Species | Notes | Reference |
|---|---|---|---|---|
| 8820 ± 360 | 
|
Ram | Expression Vector: Ram
Enzyme: Cyclooxygenase-1 pH: 8 Temperature: 30 ± 0.2 °C |
[3] |
| Mode (min-1) | Confidence Interval | Location parameter (μ) | Scale parameter (σ) |
|---|---|---|---|
| 8.81E+03 | 1.04E+00 | 9.09E+00 | 4.08E-02 |
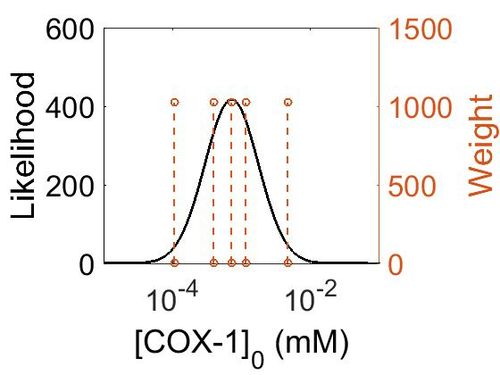
Enzyme concentration
| Value | Units | Species | Notes | Reference |
|---|---|---|---|---|
| 1176 | 
|
Human | Expression Vector: Urinary Bladder
Enzyme: Cyclooxygenase-1 (PGTS1) pH: 7.5 Temperature: 37 °C |
[4] |
| 849 | 
|
Human | Expression Vector: Platlet
Enzyme: Cyclooxygenase-1 (PGTS1) pH: 7.5 Temperature: 37 °C |
[4] |
| 208 | 
|
Human | Expression Vector: Stomach
Enzyme: Cyclooxygenase-1 (PGTS1) pH: 7.5 Temperature: 37 °C |
[5] |
| 130 | 
|
Human | Expression Vector: Esophagus
Enzyme: Cyclooxygenase-1 (PGTS1) pH: 7.5 Temperature: 37 °C |
[5] |
| 70.8 | 
|
Human | Expression Vector: Oral Cavity
Enzyme: Cyclooxygenase-1 (PGTS1) pH: 7.5 Temperature: 37 °C |
[5] |
| 19.1 | 
|
Human | Expression Vector: Lung
Enzyme: Cyclooxygenase-1 (PGTS1) pH: 7.5 Temperature: 37 °C |
[4] |
| Mode (mM) | Confidence Interval | Location parameter (μ) | Scale parameter (σ) |
|---|---|---|---|
| 4.18E+28 | 1.00E+01 | 6.67E+01 | 8.90E-01 |
References
- ↑ P. Silva, "A theoretical study of radical-only and combined radical/carbocationic mechanisms of arachidonic acid cyclooxygenation by prostaglandin H synthase" Theor Chem Acc (2003) 110: 345
- ↑ Y. Noreen Development of a Radiochemical Cyclooxygenase-1 and -2 in Vitro Assay for Identification of Natural Products as Inhibitors of Prostaglandin BiosynthesisJ. Nat. Prod., 1998, 61 (1), pp 2–7)
- ↑ 3.0 3.1 Mukherjee Molecular Oxygen Dependent Steps in Fatty Acid Oxidation by Cyclooxygenase-1 Biochemistry, 2007, 46 (13), pp 3975–3989
- ↑ 4.0 4.1 4.2 M. Kim A draft map of the human proteome Nature, 2014 509, 575–581
- ↑ 5.0 5.1 5.2 [http://www.nature.com/nature/journal/v509/n7502/pdf/nature13319.pdf M. Wilhelm Mass-spectrometry-based draft of the human proteome Nature, 2014 509, 582–587]


