Transformation of PGH2 to PGF2α
The isomerisation of PGH2 to PGF2α is performed by PGFS. This reaction results in the formation of two hydroxyl groups at C9 and C11. Two isoforms of PGFS have been reported in the literature in humans, the aldo-keto reductase family 1-member C3 isoform (encoded by the AKR1C3 gene) and the prostamide/prostaglandin F synthase isoform (encoded by the PRXL2B gene).
Contents
Reaction
Chemical equation

Rate equation
Enzyme Parameters
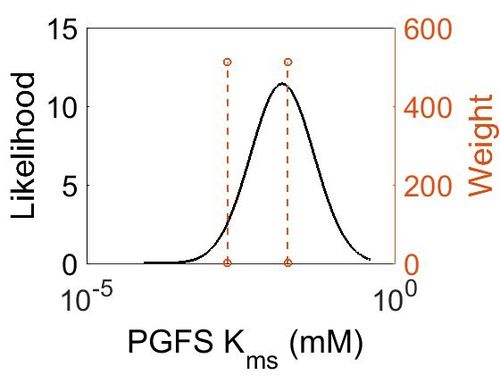
Kms
| Value | Units | Species | Notes | Weight | Reference |
|---|---|---|---|---|---|
| 1.90E-03 ± 1.5E-03 | 
|
Human | Placental Aldose Reductase (AKR1B1), E. Coli, pH 7, 37°C | 512 | [1] |
| 1.80E-02 | 
|
Human | Lung PGF2a Synthase (AKR1C3), E. Coli, pH 7, 37°C | 512 | [1] |
| Mode (mM) | Confidence Interval | Location parameter (µ) | Scale parameter (σ) |
|---|---|---|---|
| 1.33E-02 | 3.81E+00 | -3.45E+00 | 9.33E-01 |
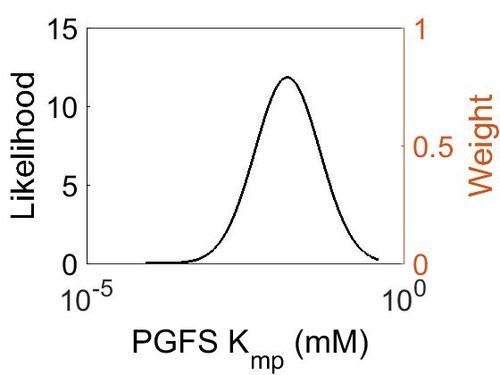
Kmp
This is a “Dependent parameter”, meaning that the log-normal distribution for this parameter was calculated using multivariate distributions (this is discussed in detail here). As a result, no confidence interval factor or literature values were cited for this parameter.
| Mode (mM) | Location parameter (µ) | Scale parameter (σ) |
|---|---|---|
| 1.46E-02 | -2.86E+00 | 1.17E+00 |
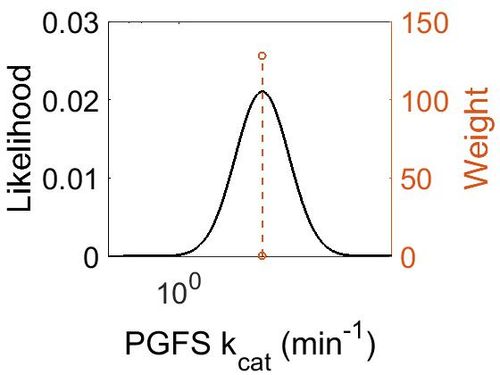
kcat
| Value | Units | Species | Notes | Weight | Reference |
|---|---|---|---|---|---|
| 14.9 | per minute | Mouse/Swine | Prostamide/PGF Synthase Purified
from Swine Brain and of Murine Enzyme Expressed in E. coli |
128 | [2] |
| Mode (min-1) | Confidence Interval | Location parameter (µ) | Scale parameter (σ) |
|---|---|---|---|
| 1.48E+01 | 1.10E+00 | 2.71E+00 | 9.49E-02 |
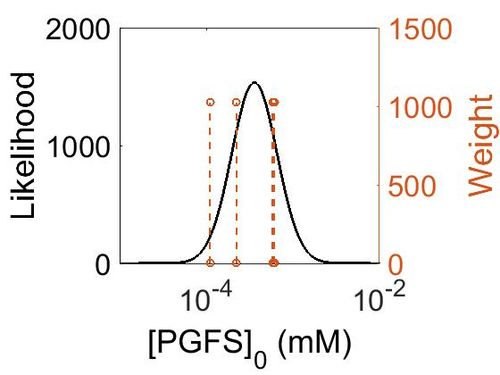
Enzyme concentration
To convert the enzyme concentration from ppm to mM, the following equation was used.
| Value | Units | Species | Notes | Weight | Reference |
|---|---|---|---|---|---|
| 105 | 
|
Human | Expression Vector: Platelet
Enzyme: PGFS pH: 7.5 Temperature: 37 °C |
1024 | [3] |
| 19.9 | 
|
Human | Expression Vector: Lung
Enzyme: PGFS pH: 7.5 Temperature: 37 °C |
1024 | [4] |
| 40.3 | 
|
Human | Expression Vector: Esophagus
Enzyme: PGFS pH: 7.5 Temperature: 37 °C |
1024 | [4] |
| 110 | 
|
Human | Expression Vector: Oral Cavity
Enzyme: PGFS pH: 7.5 Temperature: 37 °C |
1024 | [4] |
| Mode (ppm) | Mode (mM) | Confidence Interval | Location parameter (µ) | Scale parameter (σ) |
|---|---|---|---|---|
| 6.41E+01 | 3.55E-04 | 2.05E+00 | 4.53E+00 | 6.06E-01 |
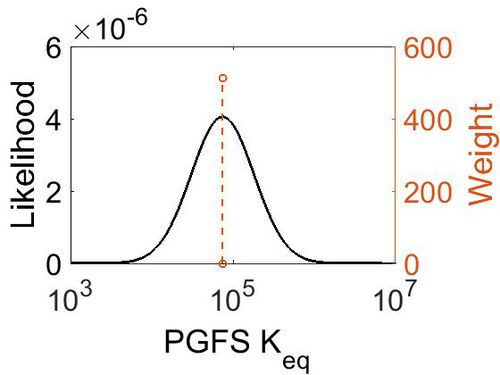
Keq
| Value | Units | Species | Notes | Weight | Reference |
|---|---|---|---|---|---|
| (-6.64) | kcal/mol | Not stated | Estimated
Enzyme: PGFS Substrate: Arachidonate Product: PGF2a pH: 7.3 ionic strength: 0.25 |
64 | [5] |
| Mode | Confidence Interval | Location parameter (µ) | Scale parameter (σ) |
|---|---|---|---|
| 7.46E+04 | 1.00E+01 | 1.20E+01 | 8.90E-01 |
References
- ↑ 1.0 1.1 Z. Kabututu, M. Manin, Prostaglandin F2alpha synthase activities of aldo-keto reductase 1B1, 1B3 and 1B7. J Biochem 2009,145(2):161-8)
- ↑ Moriuchi H., Molecular characterization of a novel type of prostamide/prostaglandin F synthase, belonging to the thioredoxin-like superfamily. J Biol Chem. 2008 Jan 11;283(2):792-801.)
- ↑ M. Kim A draft map of the human proteome Nature, 2014 509, 575–581
- ↑ 4.0 4.1 4.2 M. Wilhelm Mass-spectrometry-based draft of the human proteome Nature, 2014 509, 582–587
- ↑ Caspi et al 2014, "The MetaCyc database of metabolic pathways and enzymes and the BioCyc collection of Pathway/Genome Databases," Nucleic Acids Research 42:D459-D471


