Transformation of PGH2 to PGE2
PGE2 is produced by the isomerisation of the PGH2 peroxide, into a ketone at C9 and an alcohol at C11 by PGES, yielding PGE2. This reaction is catalysed by isoforms of PGES, such as cPGES (also known as PGES-3), mPGES-1 and mPGES-2 [1]. cPGES is the cytosolic isoform of PGES which is constitutively expressed in the cytosol of various cells [2], whereas mPGES-1/-2 are Golgi membrane-associated proteins which only become cytosolic following spontaneous cleavage of a hydrophobic domain [3][4]. It has been suggested that a functional coupling of cPGES and COX-1 may occur in vitro as cPGES appears to convert only COX-1 derived PGH2 and not COX-2 derived PGH2 [5]. Interestingly, the opposite has been observed for mPGES and COX-2 [6].
Contents
Reaction
Chemical equation

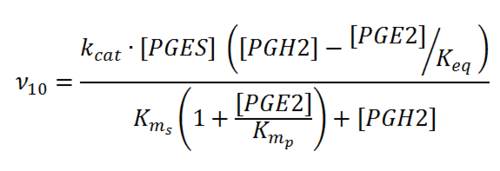
Rate equation
Parameters
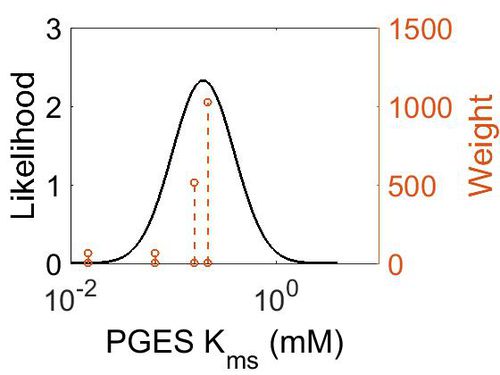
Kms
| Value | Units | Species | Notes | Weight | Reference |
|---|---|---|---|---|---|
| 1.6E-01 ± 4.00E-03 | 
|
Human | Expression Vector: E. Coli
Enzyme: PGES pH: 8 Temperature: 37 |
512 | [7] |
| 2.15E-01 | 
|
Human | Wild Type Enzyme | 1024 | [8] |
| 1.49E-02 | 
|
Human | Expression Vector: E. Coli
Enzyme: PGES pH: Unknown Temperature: Unknown Other: cPGES, casein kinase II and Hsp90 |
64 | [9] |
| 6.66E-02 | 
|
Human | Expression Vector: E. Coli
Enzyme: PGES pH: Unknown Temperature: Unknown |
64 | [9] |
| Mode (mM) | Confidence Interval | Location parameter (µ) | Scale parameter (σ) |
|---|---|---|---|
| 1.97E-01 | 1.73E+00 | -1.39E+00 | 4.91E-01 |
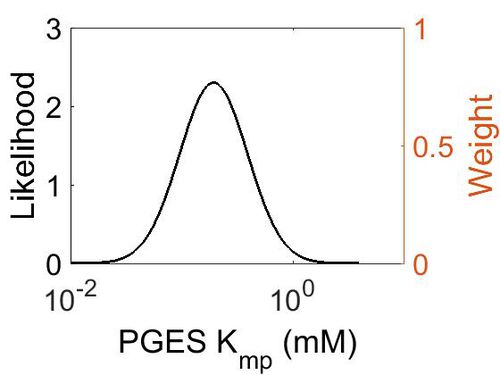
Kmp
This is a “Dependent parameter”, meaning that the log-normal distribution for this parameter was calculated using multivariate distributions (this is discussed in detail here). As a result, no confidence interval factor or literature values were cited for this parameter.
| Mode (mM) | Location parameter (µ) | Scale parameter (σ) |
|---|---|---|
| 1.93E-01 | -1.15E+00 | 7.02E-01 (mM) |
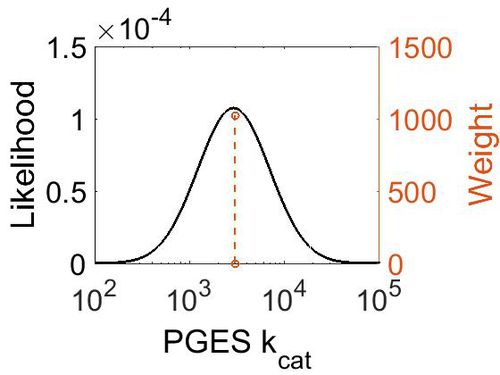
kcat
| Value | Units | Species | Notes | Weight | Reference |
|---|---|---|---|---|---|
| 3000 ± 360 | per minute | Human | Expression Vector: E. Coli.
Enzyme: Microsomal Prostaglandin E Synthase pH: 7.5 Temperature: 37 |
1024 | [10] |
| Mode (min-1) | Confidence Interval | Location parameter (µ) | Scale parameter (σ) |
|---|---|---|---|
| 2.98E+03 | 1.13E+00 | 8.01E+00 | 1.19E-01 |
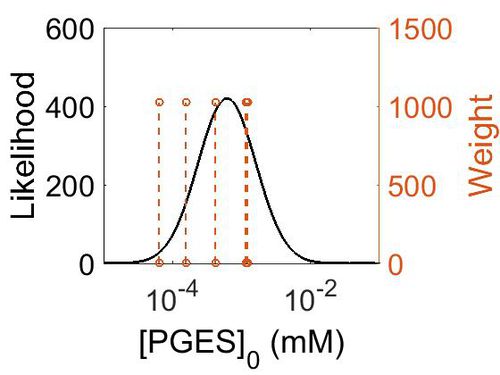
Enzyme concentration
To convert the enzyme concentration from ppm to mM, the following equation was used.
| Value | Units | Species | Notes | Weight | Reference |
|---|---|---|---|---|---|
| 220 | 
|
Human | Expression Vector: Placenta
Enzyme: PGES pH: 7.5 Temperature: 37 °C |
1024 | [11] |
| 75.3 | 
|
Human | Expression Vector: Urinary Bladder
Enzyme: PGES pH: 7.5 Temperature: 37 °C |
1024 | [12] |
| 208 | 
|
Human | Expression Vector: Stomach
Enzyme: PGES pH: 7.5 Temperature: 37 °C |
1024 | [11] |
| 28.1 | 
|
Human | Expression Vector: Lung
Enzyme: PGES pH: 7.5 Temperature: 37 °C |
1024 | [12] |
| 11.6 | 
|
Human | Expression Vector: Colon
Enzyme: PGES pH: 7.5 Temperature: 37 °C |
1024 | [12] |
| Mode (ppm) | Mode (mM) | Confidence Interval | Location parameter (µ) | Scale parameter (σ) |
|---|---|---|---|---|
| 7.49E+01 | 4.15E-04 | 3.15E+00 | 5.03E+00 | 8.44E-01 |
Keq
| Value | Units | Species | Notes | Weight | Reference |
|---|---|---|---|---|---|
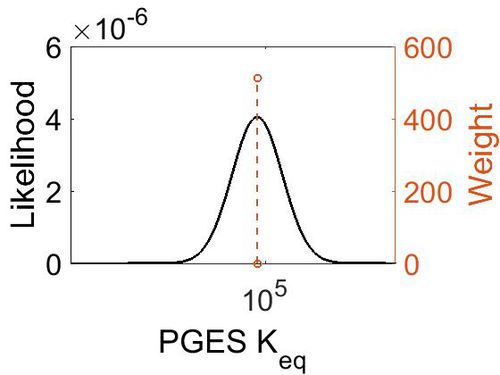
| 5.72 | kcal/mol | Not stated | Estimated
Enzyme: PGES Substrate: Arachidonate Product: PGE2 pH: 7.3 ionic strength: 0.25 |
64 | [13] |
| Mode | Confidence Interval | Location parameter (µ) | Scale parameter (σ) |
|---|---|---|---|
| 7.46E+04 | 1.00E+01 | 1.20E+01 | 8.90E-01 |
References
- ↑ Samuelsson, B. Morgenstern, R. Jakobsson, P. J. , Membrane prostaglandin E synthase-1: a novel therapeutic target, Pharmacol Rev (2007), 59, 207-24.
- ↑ Tanioka, T. Nakatani, Y. Semmyo, N. Murakami, M. Kudo, I., Molecular identification of cytosolic prostaglandin E2 synthase that is functionally coupled with cyclooxygenase-1 in immediate prostaglandin E2 biosynthesis, J Biol Chem (2000), 275, 32775-82.
- ↑ Murakami, M. Nakashima, K. Kamei, D. Masuda, S. Ishikawa, Y. Ishii, T. Ohmiya, Y. Watanabe, K. Kudo, I., Cellular prostaglandin E2 production by membrane-bound prostaglandin E synthase-2 via both cyclooxygenases-1 and -2, J Biol Chem (2003), 278, 37937-47.
- ↑ Tanioka, T. Nakatani, Y. Semmyo, N. Murakami, M. Kudo, I., Molecular identification of cytosolic prostaglandin E2 synthase that is functionally coupled with cyclooxygenase-1 in immediate prostaglandin E2 biosynthesis, J Biol Chem (2000), 275, 32775-82.
- ↑ Tanioka, T. Nakatani, Y. Semmyo, N. Murakami, M. Kudo, I., Molecular identification of cytosolic prostaglandin E2 synthase that is functionally coupled with cyclooxygenase-1 in immediate prostaglandin E2 biosynthesis, J Biol Chem (2000), 275, 32775-82.
- ↑ Murakami, M. Nakashima, K. Kamei, D. Masuda, S. Ishikawa, Y. Ishii, T. Ohmiya, Y. Watanabe, K. Kudo, I., Cellular prostaglandin E2 production by membrane-bound prostaglandin E synthase-2 via both cyclooxygenases-1 and -2, J Biol Chem (2003), 278, 37937-47.
- ↑ Pettersson P. , "Identification of beta-trace as prostaglandin D synthase. FASEB J. 2010 Dec;24(12):4668-77. doi: 10.1096/fj.10-164863. Epub 2010 Jul 28.
- ↑ Hamza A. , "Understanding microscopic binding of human microsomal prostaglandin E synthase-1 (mPGES-1) trimer with substrate PGH2 and cofactor GSH: insights from computational alanine scanning and site-directed mutagenesis. J Phys Chem B. 2010 Apr 29;114(16):5605-16. doi: 10.1021/jp100668y.
- ↑ 9.0 9.1 Kobayashi T. , "Regulation of cytosolic prostaglandin E synthase by phosphorylation. Biochem J. 2004 Jul 1;381(Pt 1):59-69.
- ↑ [www.ncbi.nlm.nih.gov/pubmed/16399384 Pettersson P., "Human microsomal prostaglandin E synthase 1: a member of the MAPEG protein superfamily. Methods Enzymol. 2005;401:147-61.]
- ↑ 11.0 11.1 M. Wilhelm Mass-spectrometry-based draft of the human proteome Nature, 2014 509, 582–587
- ↑ 12.0 12.1 12.2 M. Kim A draft map of the human proteome Nature, 2014 509, 575–581
- ↑ Caspi et al 2014, "The MetaCyc database of metabolic pathways and enzymes and the BioCyc collection of Pathway/Genome Databases," Nucleic Acids Research 42:D459-D471

