Difference between revisions of "Kinetic model of Central Metabolism"
(→Description of the model) |
|||
| Line 5: | Line 5: | ||
<imagemap> | <imagemap> | ||
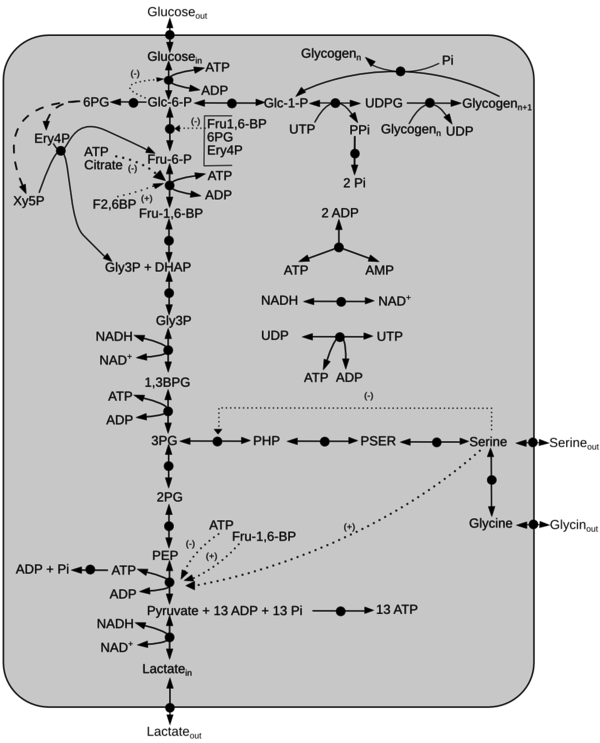
| − | Image: | + | Image:glycolysis_with_Serine_v6.png|frameless|center|600px|alt=Glycolysis with Serine Activation |
Revision as of 13:30, 21 March 2014
A kinetic model of glycolysis with serine activation is constructed from the literature data.
Description of the model
Click on a reaction to have more information

Reactions
Details of the abbreviations for this model is listed here
Initial concentration of the metabolites can be found here
Model File
Global parameters
The Vmax value in the paper "Modeling cancer glycolysis" is given in  unit [1]. To homogenize the units it is then converted back to
  by multiplying with 65 as the HeLa cell was incubated in
  .
.