Difference between revisions of "Kinetic model of Central Metabolism"
| (281 intermediate revisions by 2 users not shown) | |||
| Line 1: | Line 1: | ||
| − | A kinetic model of glycolysis with serine activation is constructed from the literature data. | + | A kinetic model of glycolysis with serine activation is constructed from the literature data <ref name="Hernandez2011"> Marín-Hernández A, Gallardo-Pérez JC, Rodríguez-Enríquez S et al (2011). ''Modeling cancer glycolysis''. Biochim Biophys Acta, 1807:755–767 ([http://dx.doi.org/10.1016/j.bbabio.2010.11.006 doi]) </ref><ref name="Turnaev_2006">Turnaev II, Ibragimova SS, Usuda Y et al (2006). ''Mathematical modeling of serine and glycine synthesis regulation in Escherichia coli''. Proceedings of the fifth international conference on bioinformatics of genome regulation and structure 2:78–83 </ref><ref name = "Smallbone_2013">Smallbone K, Stanford NJ (2013). ''Kinetic modeling of metabolic pathways: Application to serine biosynthesis''. In: Systems Metabolic Engineering, Humana Press. pp. 113–121</ref><ref name="Palm_thesis_2013> Palm, D.C. (2013). ''The regulatory design of glycogen metabolism in mammalian skeletal muscle'' (Ph.D.). University of Stellenbosch</ref><ref name="Ettore_2010> Ettore Murabito (2010). ''Application of differential metabolic control analysis to identify new targets in cancer treatment'' (Ph.D.). University of Manchester</ref>. |
== Description of the model == | == Description of the model == | ||
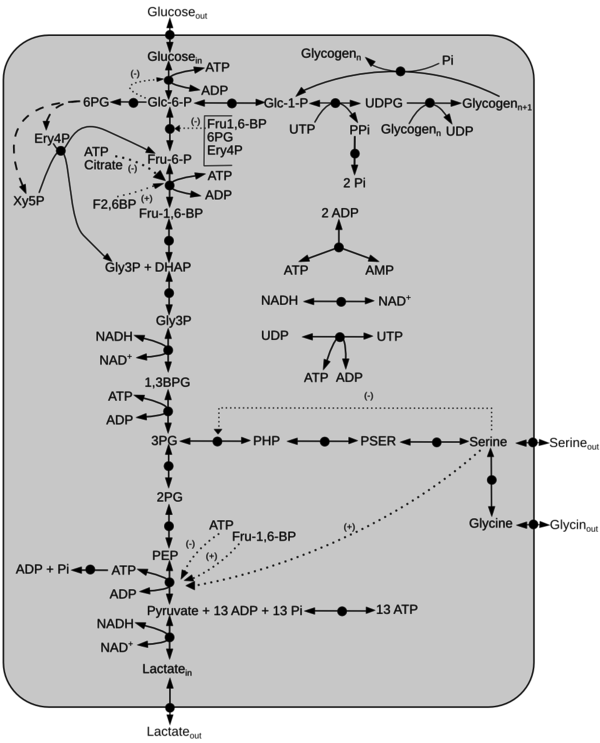
| − | Click on a reaction to have more | + | Schematic diagram of the model is given here. The dotted line represents activation(+) or inhibition(-) and the dashed arrow indicate Pentose Phosphate Pathway reactions not included in the model. Click on a reaction to have more information |
<imagemap> | <imagemap> | ||
| − | Image: | + | Image:glycolysis_with_Serine_v6_3.png|frameless|center|600px|alt=Glycolysis with Serine Activation |
| − | rect | + | |
| − | rect | + | rect 263 53 283 70 [[Glucose Transporter|GLUT]] |
| − | rect | + | rect 263 122 279 140 [[Hexokinase|HK]] |
| + | rect 263 199 283 218 [[Hexose-6-phosphate isomerase|HPI]] | ||
| + | rect 263 288 283 310 [[Phosphofructokinase type 1|PFK-1]] | ||
| + | rect 263 376 283 395 [[Fructose 1,6 bisphosphate aldolase|ALDO]] | ||
| + | rect 263 458 281 479 [[Triosephosphate isomerase|TPI]] | ||
| + | rect 263 546 281 569 [[Glyceraldehyde-3-phosphate dehydrogenase|GAPDH]] | ||
| + | rect 259 643 279 662 [[3-phosphoglycerate kinase|PGK]] | ||
| + | rect 259 727 281 750 [[3-phosphoglycerate mutase|PGAM]] | ||
| + | rect 259 824 283 846 [[Enolase|ENO]] | ||
| + | rect 261 920 284 943 [[Pyruvate kinase|PYK]] | ||
| + | rect 263 1007 283 1029 [[Lactate dehydrogenase|LDH]] | ||
| + | rect 263 1119 285 1140 [[Monocarboxylate (Lactate) transporter|MCT]] | ||
| + | rect 526 384 554 409 [[Adenylate kinase|AK]] | ||
| + | rect 138 888 160 916 [[ATPase]] | ||
| + | rect 205 156 228 179 [[Pentose Phosphate Pathway|PPP]] | ||
| + | rect 92 230 111 255 [[Transketolase|TK]] | ||
| + | rect 618 98 643 121 [[Glycogen phosphorylase|GP]] | ||
| + | rect 669 156 696 179 [[Glycogen synthase|GS]] | ||
| + | rect 537 473 562 490 [[Dehydrogenase|DHases]] | ||
| + | rect 522 519 549 547 [[Nucleosid diphosphate kinase|NDK]] | ||
| + | rect 549 225 576 252 [[Pyrophosphate phosphohydrolase|PPASE]] | ||
| + | rect 522 156 548 179 [[UDPG-pyrophosphorylase|UPP]] | ||
| + | rect 357 156 382 179 [[Phosphoglucomutase|PGLM]] | ||
| + | rect 773 751 799 777 [[Glycine hydroxymethyltransferase|SHMT]] | ||
| + | rect 834 690 854 717 [[Serine out|SERout]] | ||
| + | rect 842 826 862 846 [[Glycine out|GlYCout]] | ||
| + | rect 680 690 706 713 [[Phosphoserine phosphatase|PSP]] | ||
| + | rect 507 686 526 715 [[Phosphoserine amino-transferase|PSA]] | ||
| + | rect 335 688 361 713 [[Phosphoglycerate dehydrogenase|PDH]] | ||
| + | rect 532 961 554 987 [[Mitocondrial pyruvate metabolism|MPM]] | ||
</imagemap> | </imagemap> | ||
| + | |||
| + | <!--rect 432 953 454 978 [[TCA pseudo reaction|TCA pseudo reaction]]--> | ||
| + | <!--rect 600 953 622 978 [[Oxidative phosphorylation pseudo reaction|OXPh]]--> | ||
| + | |||
| + | ==Reactions== | ||
| + | Details of the abbreviations for this model is listed [[List of Abbreviations|here]]. Reactions of the model are listed below. | ||
| + | {|width ="100%" | ||
| + | | | ||
| + | *[[Glucose Transporter]] | ||
| + | *[[Hexokinase]] | ||
| + | *[[Pentose Phosphate Pathway]] | ||
| + | *[[Phosphoglucomutase]] | ||
| + | *[[UDPG-pyrophosphorylase]] | ||
| + | *[[Glycogen synthase]] | ||
| + | *[[Glycogen phosphorylase]] | ||
| + | *[[Hexose-6-phosphate isomerase]] | ||
| + | *[[Transketolase]] | ||
| + | *[[Phosphofructokinase type 1]] | ||
| + | *[[Fructose 1,6 bisphosphate aldolase]] | ||
| + | *[[Adenylate kinase]] | ||
| + | *[[Dehydrogenase]] | ||
| + | *[[Triosephosphate isomerase]] | ||
| + | *[[Glyceraldehyde-3-phosphate dehydrogenase]] | ||
| + | | | ||
| + | *[[3-phosphoglycerate kinase]] | ||
| + | *[[Phosphoglycerate dehydrogenase]] | ||
| + | *[[Phosphoserine amino-transferase]] | ||
| + | *[[Phosphoserine phosphatase]] | ||
| + | *[[3-phosphoglycerate mutase]] | ||
| + | *[[Enolase]] | ||
| + | *[[Pyruvate kinase]] | ||
| + | *[[ATPase]] | ||
| + | *[[Lactate dehydrogenase]] | ||
| + | *[[Monocarboxylate (Lactate) transporter]] | ||
| + | <!-- *[[TCA pseudo reaction]] --> | ||
| + | <!-- *[[Oxidative phosphorylation pseudo reaction]] --> | ||
| + | *[[Mitocondrial pyruvate metabolism]] | ||
| + | *[[Glycine hydroxymethyltransferase]] | ||
| + | *[[Serine out]] | ||
| + | *[[Glycine out]] | ||
| + | *[[Nucleosid diphosphate kinase]] | ||
| + | *[[Pyrophosphate phosphohydrolase]] | ||
| + | |} | ||
| + | |||
| + | Initial concentration of the metabolites can be found [[Metabolite concentrations|here]] | ||
| + | |||
| + | ==Model File== | ||
| + | The SBML file of the model can be found [[media:Baker_cancer_uncertainty.xml|here]] | ||
| + | |||
| + | ==Notes== | ||
| + | Necessary observation during model building and simulation is noted [[Notes|here]]. | ||
| + | |||
| + | ==Global parameters== | ||
| + | |||
| + | === Calculating <math>V_{max}</math> === | ||
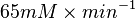
| + | Some of the Vmax value in the paper "Modeling cancer glycolysis" is given in <math> U \times \text{(mg total cellular protein)}^{-1} </math> unit <ref name="Hernandez2011"></ref>. To homogenize the units it is then converted back to <math>\frac{mM}{min}</math> by multiplying with 65 as the HeLa cell was incubated in <math> 65 \frac{\text{mg protein}}{\text{mL cell volume}}</math>. | ||
| + | |||
| + | * Converting <math> U \times \text{(mg total cellular protein)}^{-1} </math> to <math>mM \times min^{-1}</math>: | ||
| + | <math> U \times \text{(mg total cellular protein)}^{-1} = \frac{\mu mole}{min \cdot \text{(mg total cellular protein)}} = \frac{10^{-6} mole}{min \cdot \text{(mg total cellular protein)}} </math> <br> | ||
| + | Also, <math>\frac{mM}{min} = \frac{10^{-3} mole}{min \cdot liter}</math><br> | ||
| + | We want to convert 1 <math> U \times \text{(mg total cellular protein)}^{-1} </math> to <math>mM \times min^{-1}</math> where HeLa cell was incubated in <math> 65 \frac{\text{mg protein}}{\text{mL cell volume}}</math><br> | ||
| + | Therefore, <math> \frac{ 1 \times 10^{-6} mole}{ min \times \text{(mg total cellular protein)}} \times \frac{65 \text{(mg total cellular protein)}}{10^{-3} \text{(L cellular protein)}} </math> <br> | ||
| + | => <math> \frac{ 1 \times 10^{-3} \times 10^{-3} mole}{ min \times \text{(mg total cellular protein)}} \times \frac{65 \text{(mg total cellular protein)}}{10^{-3} \text{(L cellular protein)}} </math> <br> | ||
| + | Striking out the necessary elements we get | ||
| + | <math> \frac{65 \times 10^{-3} mole}{L \times min} </math><br> | ||
| + | => <math> 65 mM \times min^{-1}</math> | ||
| + | |||
| + | |||
| + | ===Quantifying the flux=== | ||
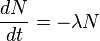
| + | We used the '''Kinetic Flux Profiling (KFP)''' <ref name="Flux_Profiling_2008">Yuan, J., Bennett, B.D. & Rabinowitz, J.D. (2008) ''Kinetic flux profiling for quantitation of cellular metabolic fluxes''. Nat. Protoc. 3, 1328–1340</ref> method to quantify the flux values. The central idea of KFP is that larger metabolic fluxes cause faster transmission of isotopic label from added nutrient to downstream metabolites. Under pseudosteady state, if an external nutrient is instantaneously switched from natural to isotopically labeled, for a metabolite X directly downstream of nutrient assimilation, unlabeled <math>X(X^U)</math> will be replaced over time by its labeled counterpart (<math>X^*</math>) and the fraction of unlabeled <math>X (X^U/X^T)</math> will decay. The rate constant of this decay <math>(K_X)</math> is determined by the ratio of the flux through <math>X (f_X)</math> to the total pool size of <math>X (X^T)</math>. | ||
| + | |||
| + | * We used first order rate constant because, labeling decay is an exponential decay and the exponential decay follows first order rate constant. | ||
| + | |||
| + | <math>\frac{dN}{dt} = - \lambda N</math> | ||
| + | |||
| + | and for first order rate equation | ||
| + | |||
| + | <math> - \frac{d[A]}{dt} = k[A]</math> | ||
| + | |||
| + | * For exponential decay the slope is the height of the function. | ||
| + | |||
| + | |||
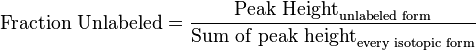
| + | * First we determine the unlabeled from for each metabolites | ||
| + | <math>\text{Fraction Unlabeled} = \frac{\text{Peak Height}_{\text{unlabeled form}}}{\text{Sum of peak height}_{\text{every isotopic form}}}</math> | ||
| + | |||
| + | * If we can calculate the apparent first order rate constant <math>K_X</math> then the flux can be calculated as <math>f_X = K_X \times X^T</math> [<math>X^T</math> is the intracellular concentration of X ]. | ||
| + | |||
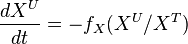
| + | * With <math>X^T</math> at steady-state, we calculate the change of unlabeled fraction with the introduction of label as | ||
| + | <math>\frac{dX^{U}}{dt} = -f_X (X^{U}/X^{T}) </math> | ||
| + | |||
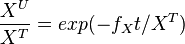
| + | The analytical solution is | ||
| + | <math>\frac{X^U}{X^T} = exp(-f_Xt/X^T)</math> | ||
| + | |||
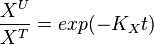
| + | setting <math>K_X = \frac{f_X}{X^T}</math>, we get | ||
| + | <math>\frac{X^U}{X^T} = exp(-K_Xt)</math> | ||
| + | |||
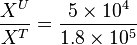
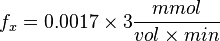
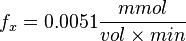
| + | '''Example:'''<br> | ||
| + | To explain the procedure we took the example of Pyruvate in the presence of Serine and Glycine. | ||
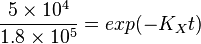
| + | <math>\frac{X^U}{X^T} = \frac{5 \times 10^4}{ 1.8 \times 10^5}</math> | ||
| + | |||
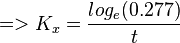
| + | So, <br> | ||
| + | <math>\frac{5 \times 10^4}{ 1.8 \times 10^5} = exp(-K_Xt)</math><br> | ||
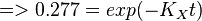
| + | <math>=> 0.277 = exp(-K_Xt) </math><br> | ||
| + | <math>=> log_e(0.277) = -K_Xt </math><br> | ||
| + | <math>=> K_x = \frac{log_e(0.277)}{t} </math><br> | ||
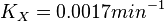
| + | <math>K_X = 0.0017 min^{-1}</math><br> | ||
| + | |||
| + | Now we know, <math>f_X = K_X \times X^T</math>. The intracellular concentration of <math>X^T = 3 \text{mM or}\frac{mmol}{vol}</math>. | ||
| + | |||
| + | So, <math>f_x = K_X \times X^T</math><br> | ||
| + | <math>f_x = 0.0017 \times 3 \frac{mmol}{vol \times min}</math><br> | ||
| + | <math>f_x = 0.0051 \frac{mmol}{vol \times min}</math> | ||
| + | |||
| + | ==References== | ||
| + | <references/> | ||
Latest revision as of 15:54, 9 December 2014
A kinetic model of glycolysis with serine activation is constructed from the literature data [1][2][3][4][5].
Contents
Description of the model
Schematic diagram of the model is given here. The dotted line represents activation(+) or inhibition(-) and the dashed arrow indicate Pentose Phosphate Pathway reactions not included in the model. Click on a reaction to have more information

Reactions
Details of the abbreviations for this model is listed here. Reactions of the model are listed below.
Initial concentration of the metabolites can be found here
Model File
The SBML file of the model can be found here
Notes
Necessary observation during model building and simulation is noted here.
Global parameters
Calculating 
Some of the Vmax value in the paper "Modeling cancer glycolysis" is given in  unit [1]. To homogenize the units it is then converted back to
  by multiplying with 65 as the HeLa cell was incubated in
  .
.
- Converting to
 :
:

Also, 
We want to convert 1 to where HeLa cell was incubated in
Therefore, 
=> 
Striking out the necessary elements we get
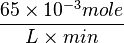
=> 
Quantifying the flux
We used the Kinetic Flux Profiling (KFP) [6] method to quantify the flux values. The central idea of KFP is that larger metabolic fluxes cause faster transmission of isotopic label from added nutrient to downstream metabolites. Under pseudosteady state, if an external nutrient is instantaneously switched from natural to isotopically labeled, for a metabolite X directly downstream of nutrient assimilation, unlabeled  will be replaced over time by its labeled counterpart (
 ) and the fraction of unlabeled
  will decay. The rate constant of this decay
  is determined by the ratio of the flux through
  to the total pool size of
  .
.
- We used first order rate constant because, labeling decay is an exponential decay and the exponential decay follows first order rate constant.
and for first order rate equation
![- \frac{d[A]}{dt} = k[A]](/wiki/images/math/e/8/0/e802dbfb8a252f2bf0c9729a4e6e66bb.png)
- For exponential decay the slope is the height of the function.
- First we determine the unlabeled from for each metabolites
- If we can calculate the apparent first order rate constant
 then the flux can be calculated as
 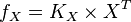 [
[ is the intracellular concentration of X ].
- With at steady-state, we calculate the change of unlabeled fraction with the introduction of label as
The analytical solution is
setting  , we get
Example:
To explain the procedure we took the example of Pyruvate in the presence of Serine and Glycine.
So,
Now we know, . The intracellular concentration of 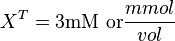 .
.
So, 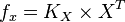
References
- ↑ 1.0 1.1 Marín-Hernández A, Gallardo-Pérez JC, Rodríguez-Enríquez S et al (2011). Modeling cancer glycolysis. Biochim Biophys Acta, 1807:755–767 (doi)
- ↑ Turnaev II, Ibragimova SS, Usuda Y et al (2006). Mathematical modeling of serine and glycine synthesis regulation in Escherichia coli. Proceedings of the fifth international conference on bioinformatics of genome regulation and structure 2:78–83
- ↑ Smallbone K, Stanford NJ (2013). Kinetic modeling of metabolic pathways: Application to serine biosynthesis. In: Systems Metabolic Engineering, Humana Press. pp. 113–121
- ↑ Palm, D.C. (2013). The regulatory design of glycogen metabolism in mammalian skeletal muscle (Ph.D.). University of Stellenbosch
- ↑ Ettore Murabito (2010). Application of differential metabolic control analysis to identify new targets in cancer treatment (Ph.D.). University of Manchester
- ↑ Yuan, J., Bennett, B.D. & Rabinowitz, J.D. (2008) Kinetic flux profiling for quantitation of cellular metabolic fluxes. Nat. Protoc. 3, 1328–1340