Transcription of a
The scbA gene is transcribed into scbA mRNA (a).


Contents
Chemical equation
 (maximum transcription in the scenario where the activating complex
  does not exist or basal transcription in the scenario where the activating complex exists)
  (maximum transcription in the scenario where the activating complex exists)
  (maximum transcription in the scenario where
  is an activator for scbA)
  (maximum transcription in the scenario where is an activator for scbA)
  (maximum transcription in the scenario where is an activator for scbA and the activating complex exists)
  (maximum transcription in the scenario where is an activator for scbA and the activating complex exists)
 Rate equation
![r= T_{A}\cdot [O_{A}]](/wiki/images/math/e/7/b/e7bcf235643659097dda4bfe871ef694.png) (for overlapping promoters in the scenario where the activating complex
(for overlapping promoters in the scenario where the activating complex  does not exist)
![r= \Omega_{A}\cdot [O_{A}]](/wiki/images/math/0/7/c/07cba8e284bc9e9e4a6ea7bbdbc657ac.png) (for isolated promoters in the scenario where the activating complex does not exist)
(for isolated promoters in the scenario where the activating complex does not exist)![r= T_{A}\cdot [O_{A}-AR_{2}]](/wiki/images/math/3/4/a/34a820d2cb015655f7c687ec64b7ec84.png) (maximal transcription for overlapping promoters in the scenario which includes the complex)
(maximal transcription for overlapping promoters in the scenario which includes the complex)![r= \Omega_{A}\cdot [O_{A}-AR_{2}]](/wiki/images/math/9/b/a/9baaeb7a7218b26b7ffacbfcf8f0ba6e.png) (maximal transcription for isolated promoters in the scenario which includes the complex)
(maximal transcription for isolated promoters in the scenario which includes the complex)![r= T_{A_{basal}}\cdot [O_{A}]](/wiki/images/math/1/2/0/1208ad7b2ce877e808fc12b76f15ecbf.png) (basal transcription for overlapping promoters in the scenario which includes the complex and/or
(basal transcription for overlapping promoters in the scenario which includes the complex and/or  being an activator for scbA)
![r= \Omega_{A_{basal}}\cdot [O_{A}]](/wiki/images/math/c/e/2/ce27049f76619b4d8eb5c3caf56e0bcf.png) (basal transcription for isolated promoters in the scenario which includes the complex and/or being an activator for scbA)
(basal transcription for isolated promoters in the scenario which includes the complex and/or being an activator for scbA)![r= T_{A}\cdot [O_{A}-R_{2}]](/wiki/images/math/7/1/d/71d8163b63f6714b27b83e6b41ad6044.png) (maximal transcription for overlapping promoters in the scenario where is an activator for scbA)
(maximal transcription for overlapping promoters in the scenario where is an activator for scbA)![r= T_{A}\cdot [O_{A}-2R_{2}]](/wiki/images/math/5/1/5/515e05ee9309a4e6b5d23a812ca4f5a7.png) (maximal transcription for overlapping promoters in the scenario where is an activator for scbA)
(maximal transcription for overlapping promoters in the scenario where is an activator for scbA)![r= \Omega_{A}\cdot [O_{A}-R_{2}]](/wiki/images/math/1/e/5/1e5b4821f689844b8b41b2f6dad371a5.png) (maximal transcription for isolated promoters in the scenario where is an activator for scbA complex)
(maximal transcription for isolated promoters in the scenario where is an activator for scbA complex)![r= \Omega_{A}\cdot [O_{A}-2R_{2}]](/wiki/images/math/6/7/9/67946b2b5206466d777de6660cf1398d.png) (maximal transcription for isolated promoters in the scenario where is an activator for scbA complex)
(maximal transcription for isolated promoters in the scenario where is an activator for scbA complex)Parameters
The parameters of this reaction are the basal and maximum transcription rate of scbA ( and
and  ).
These parameters are derived by the strength of the promoter (
).
These parameters are derived by the strength of the promoter ( and
and  ) but also taking into account the transcriptional interference by the scbR promoter. In this model, we have assumed that the isolated promoter strength is equal to the number of transcripts produced per unit of time. Therefore, the parameters and are assumed to be equal to the transcription rate constant of the isolated promoter. These parameter values were derived from published data on E.coli mRNA transcription rate and calculations based on genomic properties of Streptomyces coelicolor A3(2). Additionally, the firing rate (elongation initiation rate) constant (
 ) is needed. This parameter is also derived from literature and is sampled from the same distribution for both scbR and scbA promoters, but is then divided by a heterogeneity factor
  to calculate the final
  for the scbA promoter. The heterogeneity factor for each promoter is sampled from a log-normal distribution.
| Name | Value | Units | Value in previous GBL models [1] [2] | Remarks-Reference |
|---|---|---|---|---|
|
|
 [2] [3] [4] [5] [2] [3] [4] [5]
|

|
 [2] [2]
Bistability range: ( |
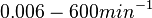
In the model investigating the quorum sensing switch in Vibrio fischeri, Weber et al. [3] have used the ratio between basal and maximal transcription rates of 0.01 and 0.001, based on the characteristics shown in the experiments by Williams et al. [5]. Through these ratios, an estimation on the range of basal transcription of our system can be made from the maximum transcription rate (), i.e., 
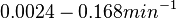
Additionally, in the GBL model by Chatterjee et al. [2], the basal transcription rates employed are within the range |
|
|
 [6] [7] [8] [6] [7] [8]
|
|
 [1][2] [1][2]
Range tested: ( Bistability range: ( and ( |
In a recent publication by R.A. Cox, genomic properties and macromolecular compositions of Streptomyces coelicolor A3(2) and E.coli were reported, along with equations that connect these properties. For S. coelicolor, the polypeptide elongation rate  is reported to be 3.17 amino acids s-1, from which the mRNA elongation rate can be calculated according to Cox from the equation is reported to be 3.17 amino acids s-1, from which the mRNA elongation rate can be calculated according to Cox from the equation  (factor 3 reflects the number of nucleotides per codon), therefore resulting in (factor 3 reflects the number of nucleotides per codon), therefore resulting in  and and  nucleotides nucleotides  as minimum and maximum values respectively. As ScbA has 945 pb, the transcription rate constant can be calculated as per as minimum and maximum values respectively. As ScbA has 945 pb, the transcription rate constant can be calculated as per 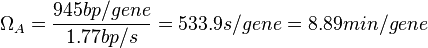 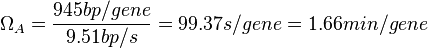 , thus resulting in final values of , thus resulting in final values of  and and  . .
Additionally, Bremer et al. have reported an mRNA transcription rate of 55 noucleotides/s for E. coli, a value which is also shared by R.A. Cox, while Vogel et al. have published a range of mRNA transcription rates in the range of 28-89 noucleotides/s, depending on different growth rates of E. coli. By the same calculations, the corresponding transcription rate constants are |
|
|
 [9] [10] [11] [9] [10] [11]
|
|
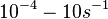
N/A | Pai et al. reported a typical transcription initiation rate in QS systems to be  . .
 Pai et al. 2009 [9] This value is also supported by Kennell et al. who calculated the transcription initiation rates from experimental data derived from in vitro experiments using E. coli. The results showed one initiation every 3.3 sec (therefore transcription rate  Kennell et al. 1977 [11] Finally, Tadmor et al. reported a maximum transcription initiation rate of  Tadmor et al. 2008 [10] |

 )
)
 )
)
 )
)
 )
)


 and
and  .
.


 ).
).

In order to include the strength of the promoter in the transcription rate, the following formula is used:  [12]. In this way, a distribution with the values for parameter
  is obtained (rate of RNA polymerase binding the promoter), which is necessary to link the firing rate with the total transcription rate according to the formulas suggested by Bendtsen et al. [12].
From the
is obtained (rate of RNA polymerase binding the promoter), which is necessary to link the firing rate with the total transcription rate according to the formulas suggested by Bendtsen et al. [12].
From the  and the , the maximal occupancy for the isolated scbA promoter can be calculated by using the formula:
  . The promoter aspect ratio
  is equal to
  , which leads to the equivalent equation
  .
The total transcription rate in the case of the isolated (uncoupled) promoters is calculated through the formula:
.
The total transcription rate in the case of the isolated (uncoupled) promoters is calculated through the formula:  . Similarly, the effective occupancy of the isolated scbR promoter (
 ) is calculated as described in theTranscription of r.
In the case of the overlapping (coupled) promoters the maximal occupancy for the scbA promoter is
) is calculated as described in theTranscription of r.
In the case of the overlapping (coupled) promoters the maximal occupancy for the scbA promoter is  , where
  is the promoter aspect ratio for the isolated scbR promoter.
Therefore, the final transcription rate constant is calculated as per
is the promoter aspect ratio for the isolated scbR promoter.
Therefore, the final transcription rate constant is calculated as per  .
.
Parameters with uncertainty
When deciding how to describe the uncertainty for this parameter we must take into consideration that the reported values are either calculated or derived with approximation from experiments and from other macromolecular properties. Additionally, some of the values correspond to mRNA transcription rates of different bacteria species (E. coli). This means that there might be a notable difference between actual parameter values and the ones reported in literature. These facts influence the quantification of the parameter uncertainty and therefore the shape of the corresponding distributions. Therefore, by assigning the appropriate weights to the parameter values and using the method described here, the appropriate probability distributions were designed.
Therefore, although the weight of the distribution is put on the values calculated for S. coelicolor by setting  as the mode of the log-normal distribution for the , we wish to explore the full range of reported values. Thus, the Spread is set to
  and the range where 68.27% of the values are found is between
  and
and  .
.
With regards to the firing rate  , the reported values are within the range of
  with the most probable values being
  . Since these values are reported as being the average rates (and
  being the maximum), we will also sample lower values, so the final sampling range will be around the values
  . The mode of the distribution is set to
  and the Spread is set to
  . Therefore, the range where 68.27% of the values are found is between
  and
and  .
.
From the literature values of and , the values for are calculated. By assigning the same weights to each of the values as of the values, a distribution with a mode of  and a Spread of
  is generated. The range where 68.27% of the values are found is between
  and
and  .
.
With regards to the basal transcription rate , in order to explore the full range of the literature values, the mode was set to  and the Spread to
  . Therefore the range where 68.27% of the values are found is between
  and
and  .
.
As performed for , the values for  are calculated from the literature values of and . By assigning the same weights to each of the values as of the values, a distribution with a mode of
  and a Spread of
  is generated. The range where 68.27% of the values are found is between and
  .
.
Finally, the heterogeneity factor can be set so that  or
or  . In the first case, has values within the range 1-10 and in the second within the range 0.1-0.9. In order for the two promoters to have equal strength, is set to be equal to 1.
Therefore, the mode of the heterogeneity factor is
. In the first case, has values within the range 1-10 and in the second within the range 0.1-0.9. In order for the two promoters to have equal strength, is set to be equal to 1.
Therefore, the mode of the heterogeneity factor is  and the Spread is
  (68.27% of the values are found between
  and
and  ), in the case where scbR promoter is stronger. In the opposite case the mode is
  and the Spread is
  (68.27% of the values are found between
  and
and  ).
).
The probability distributions for the parameters, adjusted accordingly in order to reflect the above values, are the following:


The values retrieved from literature and their weights are indicated by the blue dashed lines, and the uncertainty for each value is indicated using the reported experimental error (green lines) or a default value of 10% error (orange lines).
The parameter information of the distributions is:
| Parameter | Mode | Spread | μ | σ |
|---|---|---|---|---|
|
|

|
|

|

|
|
|

|
|

|

|
|
|

|
|

|

|
|
|

|
|

|

|
|
|

|
|

|

|
| ()
|
|
|

|

|
References
- ↑ 1.0 1.1 1.2 1.3 S. Mehra, S. Charaniya, E. Takano, and W.-S. Hu. A bistable gene switch for antibiotic biosynthesis: The butyrolactone regulon in streptomyces coelicolor. PLoS ONE, 3(7), 2008.
- ↑ 2.0 2.1 2.2 2.3 2.4 2.5 A. Chatterjee, L. Drews, S. Mehra, E. Takano, Y.N. Kaznessis, and W.-S. Hu. Convergent transcription in the butyrolactone regulon in streptomyces coelicolor confers a bistable genetic switch for antibiotic biosynthesis. PLoS ONE, 6(7), 2011.
- ↑ 3.0 3.1 M. Weber and J. Buceta. Dynamics of the quorum sensing switch: Stochastic and non-stationary effects. BMC Systems Biology 2013,(7):6
- ↑ 4.0 4.1 Nam V. Vo, Lilian M. Hsu, Caroline M. Kane, Michael J. Chamberlin. In Vitro Studies of Transcript Initiation by Escherichia coli RNA Polymerase. 3. Influences of Individual DNA Elements within the Promoter Recognition Region on Abortive Initiation and Promoter Escape Biochemistry 2003,42(13),3798-3811
- ↑ 5.0 5.1 Williams JW, Cui X, Levchenko A, Stevens AM. Robust and sensitive control of a quorum-sensing circuit by two interlocked feedback loops. Molecular Systems Biology. 2008;4:234
- ↑ 6.0 6.1 6.2 Cox RA. Quantitative relationships for specific growth rates and macromolecular compositions of Mycobacterium tuberculosis, Streptomyces coelicolor A3(2) and Escherichia coli B/r: an integrative theoretical approach. Microbiology. 2004 May;150(Pt 5):1413-26.
- ↑ 7.0 7.1 Bremer H., Yuan D. RNA chain growth-rate in Escherichia coli, Journal of Molecular Biology, 1968; 38:(2), p. 163-180
- ↑ 8.0 8.1 Vogel U., Jensen KF. The RNA chain elongation rate in Escherichia coli depends on the growth rate. Journal of Bacteriology. 1994;176(10):2807-2813.
- ↑ 9.0 9.1 Pai, A. and You, L. Optimal tuning of bacterial sensing potential. Mol Syst Biol. 2009; 5: 286
- ↑ 10.0 10.1 Tadmor AD, Tlusty T. A Coarse-Grained Biophysical Model of E. coli and Its Application to Perturbation of the rRNA Operon Copy Number. PLoS Comput Biol (2008); 4(5): e1000038. doi: 10.1371/journal.pcbi.1000038
- ↑ 11.0 11.1 Kennell D., Riezman H. Transcription and translation initiation frequencies of the Escherichia coli lac operon. J. Mol. Biol. 1977; 114(1):1-21
- ↑ 12.0 12.1 Bendtsen KM, Erdőssy J, Csiszovszki Z, et al. Direct and indirect effects in the regulation of overlapping promoters. Nucleic Acids Research. 2011;39(16):6879-6885. doi:10.1093/nar/gkr390.