Difference between revisions of "Transformation of PGH2 to PGE2"
(→Parameters) |
(→Enzyme concentration) |
||
| Line 122: | Line 122: | ||
=== Enzyme concentration === | === Enzyme concentration === | ||
| + | |||
| + | To convert the enzyme concentration from ppm to mM, the following [[Common equations#Enzyme concentration (mM)|equation]] was used. | ||
| + | |||
{|class="wikitable sortable" | {|class="wikitable sortable" | ||
|+ style="text-align: left;" | Literature values | |+ style="text-align: left;" | Literature values | ||
| Line 186: | Line 189: | ||
{| class="wikitable" | {| class="wikitable" | ||
|+ style="text-align: left;" | Description of the PGES concentration distribution | |+ style="text-align: left;" | Description of the PGES concentration distribution | ||
| − | ! Mode !! Confidence Interval !! Location parameter (µ) !! Scale parameter (σ) | + | ! Mode (ppm) !! Mode (mM) !! Confidence Interval !! Location parameter (µ) !! Scale parameter (σ) |
|- | |- | ||
| − | | 7.49E+01 || 3.15E+00 || 5.03E+00 || 8.44E-01 | + | | 7.49E+01 ||4.15E-04 || 3.15E+00 || 5.03E+00 || 8.44E-01 |
|} | |} | ||
Revision as of 10:20, 30 May 2019
PGE2 is an incredibly bioactive compound, which upon binding with the receptors, an immune cellular response is triggered. For example in the binding of PGE2 to EP2 and EP4, dendritic cell (DC) migration and maturation is activated (Legler, Krause et al. 2006, van Helden, Krooshoop et al. 2006). This event results in the activation of Th2 cells, which produce cytokines that in turn stimulates further inflammatory species (McIlroy, Caron et al. 2006, Theiner, Gessner et al. 2006). Furthermore binding of PGE2 to EP4 stimulates infiltration of macrophages from the bloodstream.
PGE2 is synthesised from PGH2 via the prostaglandin E synthase (PGES) enzyme. This influential species is produced by almost all cutaneous cell types and as a consequence is in high concentrations in the skin (Ziboh 1992, Cho, Park et al. 2005, Gledhill, Rhodes et al. 2010). In addition to affecting DCs, the species acts as a chemoattractant for keratinocyte cells (Parekh, Sandulache et al. 2009) and in normal and inflamed epithelial cells PGE2 possess an inhibitory effect on the release of leukotrienes (Shaf96).
Contents
Reaction
Chemical equation

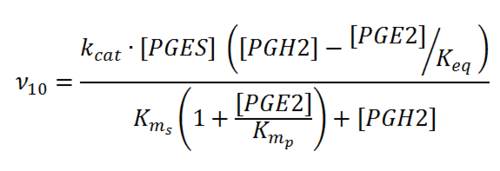
Rate equation
Parameters
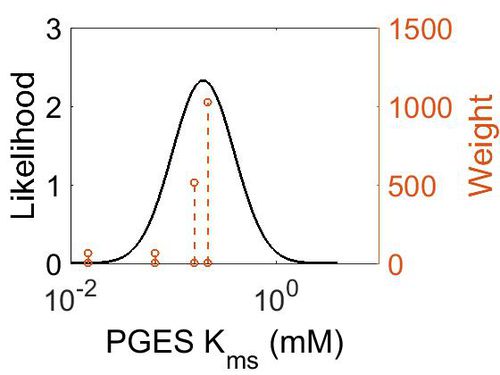
Kms
| Value | Units | Species | Notes | Weight | Reference |
|---|---|---|---|---|---|
| 1.6E-01 ± 4.00E-03 | 
|
Human | Expression Vector: E. Coli
Enzyme: PGES pH: 8 Temperature: 37 |
512 | [1] |
| 2.15E-01 | 
|
Human | Wild Type Enzyme | 1024 | [2] |
| 1.49E-02 | 
|
Human | Expression Vector: E. Coli
Enzyme: PGES pH: Unknown Temperature: Unknown Other: cPGES, casein kinase II and Hsp90 |
64 | [3] |
| 6.66E-02 | 
|
Human | Expression Vector: E. Coli
Enzyme: PGES pH: Unknown Temperature: Unknown |
64 | [3] |
| Mode (mM) | Confidence Interval | Location parameter (µ) | Scale parameter (σ) |
|---|---|---|---|
| 1.97E-01 | 1.73E+00 | -1.39E+00 | 4.91E-01 |
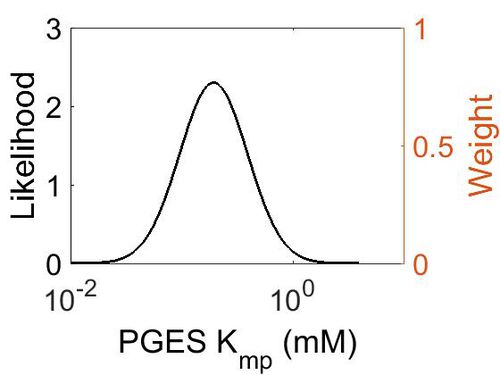
Kmp
This is a “Dependent parameter”, meaning that the log-normal distribution for this parameter was calculated using multivariate distributions (this is discussed in detail here). As a result, no confidence interval factor or literature values were cited for this parameter.
| Mode (mM) | Location parameter (µ) | Scale parameter (σ) |
|---|---|---|
| 1.93E-01 | -1.15E+00 | 7.02E-01 (mM) |
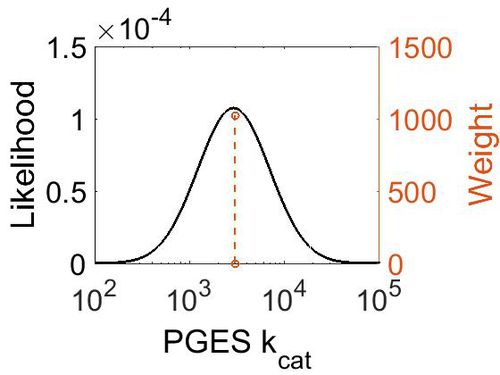
kcat
| Value | Units | Species | Notes | Weight | Reference |
|---|---|---|---|---|---|
| 3000 ± 360 | per minute | Human | Expression Vector: E. Coli.
Enzyme: Microsomal Prostaglandin E Synthase pH: 7.5 Temperature: 37 |
1024 | [4] |
| Mode (min-1) | Confidence Interval | Location parameter (µ) | Scale parameter (σ) |
|---|---|---|---|
| 2.98E+03 | 1.13E+00 | 8.01E+00 | 1.19E-01 |
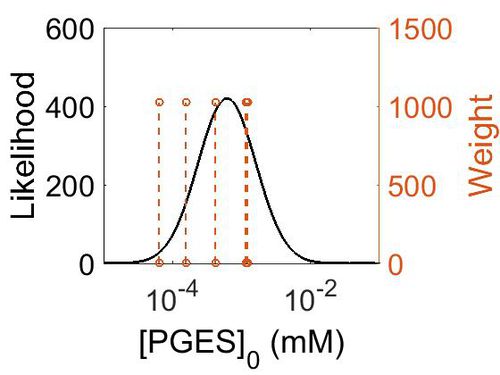
Enzyme concentration
To convert the enzyme concentration from ppm to mM, the following equation was used.
| Value | Units | Species | Notes | Weight | Reference |
|---|---|---|---|---|---|
| 220 | 
|
Human | Expression Vector: Placenta
Enzyme: PGES pH: 7.5 Temperature: 37 °C |
1024 | [5] |
| 75.3 | 
|
Human | Expression Vector: Urinary Bladder
Enzyme: PGES pH: 7.5 Temperature: 37 °C |
1024 | [6] |
| 208 | 
|
Human | Expression Vector: Stomach
Enzyme: PGES pH: 7.5 Temperature: 37 °C |
1024 | [5] |
| 28.1 | 
|
Human | Expression Vector: Lung
Enzyme: PGES pH: 7.5 Temperature: 37 °C |
1024 | [6] |
| 11.6 | 
|
Human | Expression Vector: Colon
Enzyme: PGES pH: 7.5 Temperature: 37 °C |
1024 | [6] |
| Mode (ppm) | Mode (mM) | Confidence Interval | Location parameter (µ) | Scale parameter (σ) |
|---|---|---|---|---|
| 7.49E+01 | 4.15E-04 | 3.15E+00 | 5.03E+00 | 8.44E-01 |
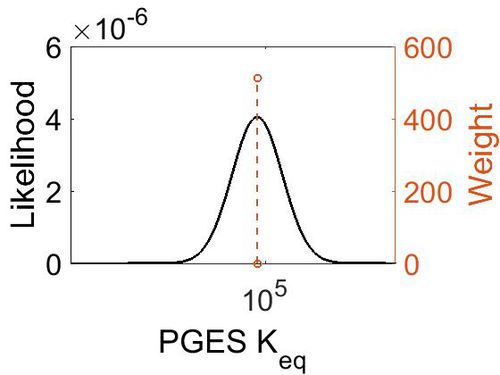
Keq
| Value | Units | Species | Notes | Weight | Reference |
|---|---|---|---|---|---|
| 5.72 | kcal/mol | Not stated | Estimated
Enzyme: PGES Substrate: Arachidonate Product: PGE2 pH: 7.3 ionic strength: 0.25 |
64 | [7] |
| Mode | Confidence Interval | Location parameter (µ) | Scale parameter (σ) |
|---|---|---|---|
| 7.46E+04 | 1.00E+01 | 1.20E+01 | 8.90E-01 |
References
- ↑ Pettersson P. , "Identification of beta-trace as prostaglandin D synthase. FASEB J. 2010 Dec;24(12):4668-77. doi: 10.1096/fj.10-164863. Epub 2010 Jul 28.
- ↑ Hamza A. , "Understanding microscopic binding of human microsomal prostaglandin E synthase-1 (mPGES-1) trimer with substrate PGH2 and cofactor GSH: insights from computational alanine scanning and site-directed mutagenesis. J Phys Chem B. 2010 Apr 29;114(16):5605-16. doi: 10.1021/jp100668y.
- ↑ 3.0 3.1 Kobayashi T. , "Regulation of cytosolic prostaglandin E synthase by phosphorylation. Biochem J. 2004 Jul 1;381(Pt 1):59-69.
- ↑ [www.ncbi.nlm.nih.gov/pubmed/16399384 Pettersson P., "Human microsomal prostaglandin E synthase 1: a member of the MAPEG protein superfamily. Methods Enzymol. 2005;401:147-61.]
- ↑ 5.0 5.1 M. Wilhelm Mass-spectrometry-based draft of the human proteome Nature, 2014 509, 582–587
- ↑ 6.0 6.1 6.2 M. Kim A draft map of the human proteome Nature, 2014 509, 575–581
- ↑ Caspi et al 2014, "The MetaCyc database of metabolic pathways and enzymes and the BioCyc collection of Pathway/Genome Databases," Nucleic Acids Research 42:D459-D471

