Difference between revisions of "Transformation of LTA4 to LTC4"
(→Parameters) |
|||
| (14 intermediate revisions by the same user not shown) | |||
| Line 1: | Line 1: | ||
[[Welcome to the In-Silico Model of Cutaneous Lipids Wiki | Return to overview]] | [[Welcome to the In-Silico Model of Cutaneous Lipids Wiki | Return to overview]] | ||
| − | + | Leukotriene C4 synthase (LTC4S) transforms LTA4 into LTC4. This reaction involves the conjugation of the LTA4 epoxide and glutathione. | |
== Reaction == | == Reaction == | ||
| − | + | [[File:R16reaction.png|center|500px]] | |
==Chemical equation== | ==Chemical equation== | ||
| − | <center><math> | + | <center><math> LTA4 \rightleftharpoons LTC4 </math></center> |
== Rate equation == | == Rate equation == | ||
| + | [[File:R16.PNG|center|500px]] | ||
== Parameters == | == Parameters == | ||
| − | + | ===K<sub>ms</sub>=== | |
{|class="wikitable sortable" | {|class="wikitable sortable" | ||
| − | |+ style="text-align: left;" | | + | |+ style="text-align: left;" | Literature Values |
|- | |- | ||
! Value | ! Value | ||
| Line 23: | Line 24: | ||
! Species | ! Species | ||
! Notes | ! Notes | ||
| + | ! Weight | ||
! Reference | ! Reference | ||
|- | |- | ||
| − | |0.3 | + | |0.3 ± 0.06 |
|mM | |mM | ||
|Human | |Human | ||
| Line 32: | Line 34: | ||
pH:7.8 | pH:7.8 | ||
Temperature:20 °C | Temperature:20 °C | ||
| + | |256 | ||
|<ref name="Rinaldo2010"> [http://www.jbc.org/content/285/52/40771.full.pdf Rinaldo A. " Arginine 104 Is a Key Catalytic Residue in Leukotriene C4 | |<ref name="Rinaldo2010"> [http://www.jbc.org/content/285/52/40771.full.pdf Rinaldo A. " Arginine 104 Is a Key Catalytic Residue in Leukotriene C4 | ||
Synthase'' J Biochem 2010, 285, 40771-40776]</ref> | Synthase'' J Biochem 2010, 285, 40771-40776]</ref> | ||
| Line 42: | Line 45: | ||
pH: 7.8 | pH: 7.8 | ||
Temperature: 37 °C | Temperature: 37 °C | ||
| − | |<ref name="Niegowski2013"> [http://www.jbc.org/content/early/2013/12/23/jbc.M113.534628 Niegowski D. " Crystal structures of Leukotriene C4 synthase in complex with product analogs, implications for the | + | |1024 |
| − | enzyme mechanism'' J. Biol. Chem. 289, 5199-5207 (2014)]</ref> | + | |<ref name="Niegowski2013"> [http://www.jbc.org/content/early/2013/12/23/jbc.M113.534628 Niegowski D. " Crystal structures of Leukotriene C4 synthase in complex with product analogs, implications for the enzyme mechanism'' J. Biol. Chem. 289, 5199-5207 (2014)]</ref> |
| + | |- | ||
| + | |} | ||
| + | |||
| + | {| class="wikitable" | ||
| + | |+ style="text-align: left;" | Description of the LTC4S Kms distribution | ||
| + | ! Mode (mM) !! Confidence Interval !! Location parameter (µ) !! Scale parameter (σ) | ||
|- | |- | ||
| + | | 3.15E-02 || 7.18E+00 || -2.83E+00 || 7.90E-01 | ||
|} | |} | ||
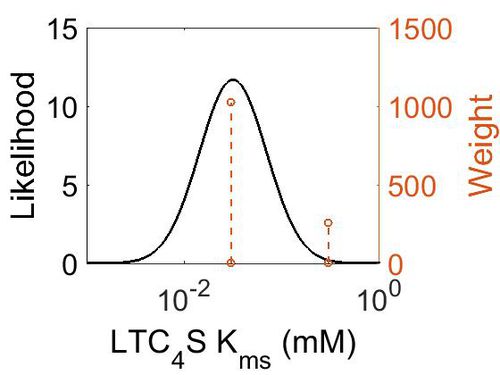
| + | [[Image:53.jpg|none|thumb|500px|The estimated probability distribution for LTC4S Kms. The value and weight of the literature values used to define the distribution are indicated by an orange dashed line. The x axis is plotted on a log-scale. ]] | ||
| + | |||
| + | ===K<sub>mp</sub>=== | ||
| + | {| class="wikitable" | ||
| + | |+ style="text-align: left;" | Description of the LTC4S Kmp distribution | ||
| + | ! Mode (mM) !! Location parameter (µ) !! Scale parameter (σ) | ||
| + | |- | ||
| + | | 3.18E-02 || -2.82E+00 || 7.92E-01 | ||
| + | |} | ||
| + | |||
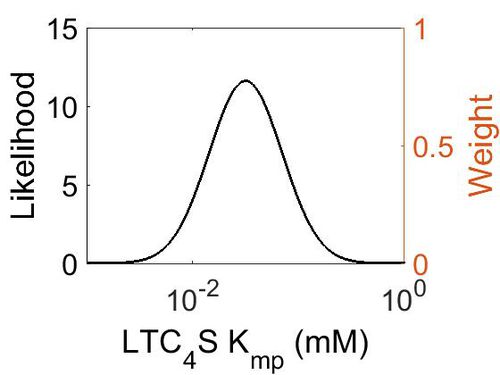
| + | [[Image:54.jpg|none|thumb|500px|The estimated probability distribution for LTC4S Kmp. The value and weight of the literature values used to define the distribution are indicated by an orange dashed line. The x axis is plotted on a log-scale. ]] | ||
| + | |||
| + | ===k<sub>cat</sub>=== | ||
{|class="wikitable sortable" | {|class="wikitable sortable" | ||
| − | |+ style="text-align: left;" | | + | |+ style="text-align: left;" | Literature Values |
|- | |- | ||
! Value | ! Value | ||
| Line 54: | Line 77: | ||
! Species | ! Species | ||
! Notes | ! Notes | ||
| + | ! Weight | ||
! Reference | ! Reference | ||
|- | |- | ||
| Line 63: | Line 87: | ||
pH:7.8 | pH:7.8 | ||
Temperature:20 °C | Temperature:20 °C | ||
| + | |256 | ||
|<ref name="Rinaldo2010"> [http://www.jbc.org/content/285/52/40771.full.pdf Rinaldo A. " Arginine 104 Is a Key Catalytic Residue in Leukotriene C4 | |<ref name="Rinaldo2010"> [http://www.jbc.org/content/285/52/40771.full.pdf Rinaldo A. " Arginine 104 Is a Key Catalytic Residue in Leukotriene C4 | ||
Synthase'' J Biochem 2010, 285, 40771-40776]</ref> | Synthase'' J Biochem 2010, 285, 40771-40776]</ref> | ||
| Line 73: | Line 98: | ||
pH: 7.8 | pH: 7.8 | ||
Temperature: 37 °C | Temperature: 37 °C | ||
| − | |<ref name="Niegowski2013"> [http://www.jbc.org/content/ | + | |1024 |
| − | enzyme mechanism'' J. Biol. Chem. 289, 5199-5207 (2014)]</ref> | + | |<ref name="Niegowski2013"> [http://www.jbc.org/content/early/2013/12/23/jbc.M113.534628 Niegowski D. " Crystal structures of Leukotriene C4 synthase in complex with product analogs, implications for the enzyme mechanism'' J. Biol. Chem. 289, 5199-5207 (2014)]</ref> |
| + | |- | ||
| + | |} | ||
| + | |||
| + | {| class="wikitable" | ||
| + | |+ style="text-align: left;" | Description of the LTC4S kcat distribution | ||
| + | ! Mode (min-1) !! Confidence Interval !! Location parameter (µ) !! Scale parameter (σ) | ||
|- | |- | ||
| + | | 1.47E+03 || 1.42E+00 || 7.40E+00 || 3.29E-01 | ||
|} | |} | ||
| + | |||
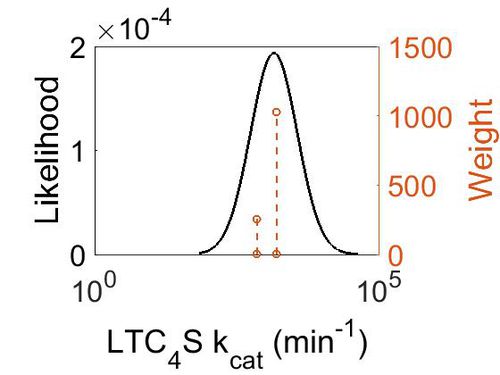
| + | [[Image:55.jpg|none|thumb|500px|The estimated probability distribution for LTC4S kcat. The value and weight of the literature values used to define the distribution are indicated by an orange dashed line. The x axis is plotted on a log-scale. ]] | ||
| + | |||
| + | === Enzyme concentration === | ||
| + | |||
| + | To convert the enzyme concentration from ppm to mM, the following [[Common equations#Enzyme concentration (mM)|equation]] was used. | ||
{|class="wikitable sortable" | {|class="wikitable sortable" | ||
| − | |+ style="text-align: left;" | | + | |+ style="text-align: left;" | Literature Values |
|- | |- | ||
! Value | ! Value | ||
| Line 85: | Line 123: | ||
! Species | ! Species | ||
! Notes | ! Notes | ||
| + | ! Weight | ||
! Reference | ! Reference | ||
|- | |- | ||
| Line 94: | Line 133: | ||
pH: 7.5 | pH: 7.5 | ||
Temperature: 37 °C | Temperature: 37 °C | ||
| + | |1024 | ||
|<ref name="Kim2014"> [http://www.nature.com/nature/journal/v509/n7502/pdf/nature13302.pdf M. Kim ''A draft map of the human proteome'' Nature, 2014 509, 575–581]</ref> | |<ref name="Kim2014"> [http://www.nature.com/nature/journal/v509/n7502/pdf/nature13302.pdf M. Kim ''A draft map of the human proteome'' Nature, 2014 509, 575–581]</ref> | ||
|- | |- | ||
| Line 103: | Line 143: | ||
pH: 7.5 | pH: 7.5 | ||
Temperature: 37 °C | Temperature: 37 °C | ||
| + | |2048 | ||
|<ref name="Kim2014"> [http://www.nature.com/nature/journal/v509/n7502/pdf/nature13302.pdf M. Kim ''A draft map of the human proteome'' Nature, 2014 509, 575–581]</ref> | |<ref name="Kim2014"> [http://www.nature.com/nature/journal/v509/n7502/pdf/nature13302.pdf M. Kim ''A draft map of the human proteome'' Nature, 2014 509, 575–581]</ref> | ||
|- | |- | ||
| Line 112: | Line 153: | ||
pH: 7.5 | pH: 7.5 | ||
Temperature: 37 °C | Temperature: 37 °C | ||
| + | |1024 | ||
|<ref name="Kim2014"> [http://www.nature.com/nature/journal/v509/n7502/pdf/nature13302.pdf M. Kim ''A draft map of the human proteome'' Nature, 2014 509, 575–581]</ref> | |<ref name="Kim2014"> [http://www.nature.com/nature/journal/v509/n7502/pdf/nature13302.pdf M. Kim ''A draft map of the human proteome'' Nature, 2014 509, 575–581]</ref> | ||
|- | |- | ||
|} | |} | ||
| + | |||
| + | {| class="wikitable" | ||
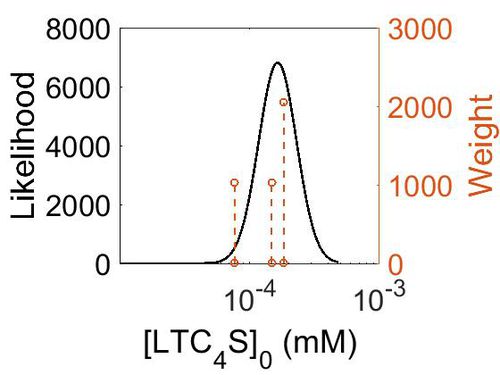
| + | |+ style="text-align: left;" | Description of the LTC4S concentration distribution | ||
| + | ! Mode (mM) !! Mode (ppm) !! Confidence Interval !! Location parameter (µ) !! Scale parameter (σ) | ||
| + | |- | ||
| + | | 2.90E+01 ||1.60E-04|| 1.44E+00 || 3.49E+00 || 3.46E-01 | ||
| + | |- | ||
| + | |} | ||
| + | |||
| + | [[Image:160.jpg|none|thumb|500px|The estimated probability distribution for LTC4S concentration. The value and weight of the literature values used to define the distribution are indicated by an orange dashed line. The x axis is plotted on a log-scale. ]] | ||
| + | |||
| + | === K<sub>eq</sub>=== | ||
{|class="wikitable sortable" | {|class="wikitable sortable" | ||
| − | |+ style="text-align: left;" | | + | |+ style="text-align: left;" | Literature Values |
|- | |- | ||
| − | ! | + | ! Gibbs Free Energy Change |
! Units | ! Units | ||
! Species | ! Species | ||
! Notes | ! Notes | ||
| + | ! Weight | ||
! Reference | ! Reference | ||
|- | |- | ||
| Line 134: | Line 189: | ||
pH: 7.3 | pH: 7.3 | ||
ionic strength: 0.25 | ionic strength: 0.25 | ||
| + | |64 | ||
|<ref name="MetaCyc”>[http://metacyc.org/META/NEW-IMAGE?type=REACTION&object=RXN66-490 Caspi et al 2014, "The MetaCyc database of metabolic pathways and enzymes and the BioCyc collection of Pathway/Genome Databases," Nucleic Acids Research 42:D459-D471]</ref> | |<ref name="MetaCyc”>[http://metacyc.org/META/NEW-IMAGE?type=REACTION&object=RXN66-490 Caspi et al 2014, "The MetaCyc database of metabolic pathways and enzymes and the BioCyc collection of Pathway/Genome Databases," Nucleic Acids Research 42:D459-D471]</ref> | ||
|} | |} | ||
| − | == | + | {| class="wikitable" |
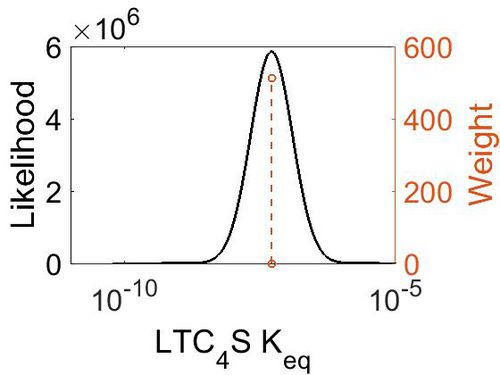
| − | + | |+ style="text-align: left;" | Description of the LTC4S Keq distribution | |
| + | ! Mode (mM) !! Confidence Interval !! Location parameter (µ) !! Scale parameter (σ) | ||
| + | |- | ||
| + | | 5.13E-08 || 1.00E+01 || -1.60E+01 || 8.90E-01 | ||
| + | |} | ||
| + | |||
| + | [[Image:56.jpg|none|thumb|500px|The estimated probability distribution for LTC4S Keq. The value and weight of the literature values used to define the distribution are indicated by an orange dashed line. The x axis is plotted on a log-scale. ]] | ||
== Related Reactions == | == Related Reactions == | ||
| − | + | ==References== | |
| − | + | <references/> | |
| − | |||
| − | |||
| − | |||
| − | |||
| − | |||
| − | |||
| − | |||
| − | |||
| − | |||
| − | |||
| − | |||
| − | |||
| − | |||
| − | |||
| − | |||
| − | |||
| − | |||
| − | |||
| − | |||
| − | |||
| − | |||
| − | |||
| − | |||
| − | |||
| − | |||
| − | |||
| − | |||
| − | |||
| − | |||
| − | |||
| − | |||
| − | |||
| − | |||
| − | |||
| − | |||
| − | |||
| − | |||
| − | |||
| − | |||
| − | |||
| − | |||
| − | |||
| − | |||
| − | |||
| − | |||
| − | |||
| − | |||
| − | |||
| − | |||
| − | |||
| − | |||
| − | |||
| − | |||
| − | |||
| − | |||
| − | |||
| − | |||
| − | |||
| − | |||
| − | |||
| − | |||
| − | |||
| − | |||
| − | |||
| − | |||
| − | |||
| − | |||
| − | |||
| − | |||
| − | |||
| − | |||
| − | |||
| − | |||
| − | |||
| − | |||
| − | |||
| − | |||
| − | |||
| − | |||
| − | |||
| − | |||
| − | |||
| − | |||
| − | |||
| − | |||
| − | |||
| − | |||
| − | |||
| − | |||
| − | |||
| − | |||
| − | |||
| − | |||
| − | |||
| − | |||
| − | |||
| − | |||
| − | |||
| − | |||
| − | |||
| − | |||
| − | |||
| − | |||
| − | |||
| − | |||
| − | |||
| − | |||
| − | |||
| − | |||
| − | |||
| − | |||
| − | |||
| − | |||
| − | |||
| − | |||
| − | |||
| − | |||
| − | |||
| − | |||
| − | |||
| − | |||
| − | |||
| − | |||
| − | |||
| − | |||
| − | |||
| − | |||
| − | |||
| − | |||
| − | |||
| − | |||
| − | |||
| − | |||
| − | |||
| − | |||
| − | |||
| − | |||
| − | |||
| − | |||
| − | |||
| − | |||
| − | |||
| − | |||
| − | |||
| − | |||
| − | |||
| − | |||
| − | |||
| − | |||
| − | |||
| − | |||
| − | |||
| − | |||
| − | |||
| − | |||
| − | |||
| − | |||
| − | |||
| − | |||
Latest revision as of 11:12, 2 November 2019
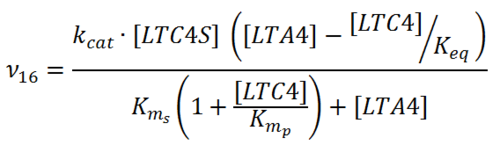
Leukotriene C4 synthase (LTC4S) transforms LTA4 into LTC4. This reaction involves the conjugation of the LTA4 epoxide and glutathione.
Contents
Reaction
Chemical equation

Rate equation
Parameters
Kms
| Value | Units | Species | Notes | Weight | Reference |
|---|---|---|---|---|---|
| 0.3 ± 0.06 | mM | Human | Expression Vector: E. Coli.
Enzyme: Wild Type hLTC4S pH:7.8 Temperature:20 °C |
256 | [1] |
| 3.00E-02 ± 1.00E-02 | mM | Human | Expression Vector: E Coli
Enzyme: Wild type LTC4S pH: 7.8 Temperature: 37 °C |
1024 | [2] |
| Mode (mM) | Confidence Interval | Location parameter (µ) | Scale parameter (σ) |
|---|---|---|---|
| 3.15E-02 | 7.18E+00 | -2.83E+00 | 7.90E-01 |
Kmp
| Mode (mM) | Location parameter (µ) | Scale parameter (σ) |
|---|---|---|
| 3.18E-02 | -2.82E+00 | 7.92E-01 |
kcat
| Value | Units | Species | Notes | Weight | Reference |
|---|---|---|---|---|---|
| 702 | per minute | Human | Expression Vector: E. Coli.
Enzyme: Wild Type hLTC4S pH:7.8 Temperature:20 °C |
256 | [1] |
| 1560 ± 240 | per minute | Human | Expression Vector: E Coli
Enzyme: Wild type LTC4S pH: 7.8 Temperature: 37 °C |
1024 | [2] |
| Mode (min-1) | Confidence Interval | Location parameter (µ) | Scale parameter (σ) |
|---|---|---|---|
| 1.47E+03 | 1.42E+00 | 7.40E+00 | 3.29E-01 |
Enzyme concentration
To convert the enzyme concentration from ppm to mM, the following equation was used.
| Value | Units | Species | Notes | Weight | Reference |
|---|---|---|---|---|---|
| 26.8 | 
|
Human | Expression Vector: Lung
Enzyme: LTC4S pH: 7.5 Temperature: 37 °C |
1024 | [3] |
| 33.0 | 
|
Human | Expression Vector: Esophagus
Enzyme: LTC4S pH: 7.5 Temperature: 37 °C |
2048 | [3] |
| 13.9 | 
|
Human | Expression Vector: Adrenal Gland
Enzyme: LTC4S pH: 7.5 Temperature: 37 °C |
1024 | [3] |
| Mode (mM) | Mode (ppm) | Confidence Interval | Location parameter (µ) | Scale parameter (σ) |
|---|---|---|---|---|
| 2.90E+01 | 1.60E-04 | 1.44E+00 | 3.49E+00 | 3.46E-01 |
Keq
| Gibbs Free Energy Change | Units | Species | Notes | Weight | Reference |
|---|---|---|---|---|---|
| 9.934128 | kcal/mol | Not stated | Estimated
Enzyme: LTC4S Substrate: LTA4 Product: LTC4 pH: 7.3 ionic strength: 0.25 |
64 | [4] |
| Mode (mM) | Confidence Interval | Location parameter (µ) | Scale parameter (σ) |
|---|---|---|---|
| 5.13E-08 | 1.00E+01 | -1.60E+01 | 8.90E-01 |
Related Reactions
References
- ↑ 1.0 1.1 [http://www.jbc.org/content/285/52/40771.full.pdf Rinaldo A. " Arginine 104 Is a Key Catalytic Residue in Leukotriene C4 Synthase J Biochem 2010, 285, 40771-40776]
- ↑ 2.0 2.1 Niegowski D. " Crystal structures of Leukotriene C4 synthase in complex with product analogs, implications for the enzyme mechanism J. Biol. Chem. 289, 5199-5207 (2014)
- ↑ 3.0 3.1 3.2 M. Kim A draft map of the human proteome Nature, 2014 509, 575–581
- ↑ Caspi et al 2014, "The MetaCyc database of metabolic pathways and enzymes and the BioCyc collection of Pathway/Genome Databases," Nucleic Acids Research 42:D459-D471

