Transformation of LTA4 to LTC4
Leukotriene C4 synthase (LTC4S) transforms LTA4 into LTC4. This reaction involves the conjugation of the LTA4 epoxide and glutathione.
Contents
Reaction
Chemical equation

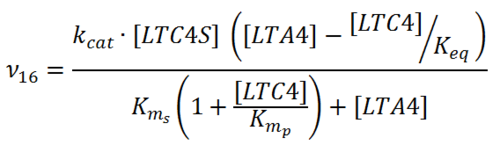
Rate equation
Parameters
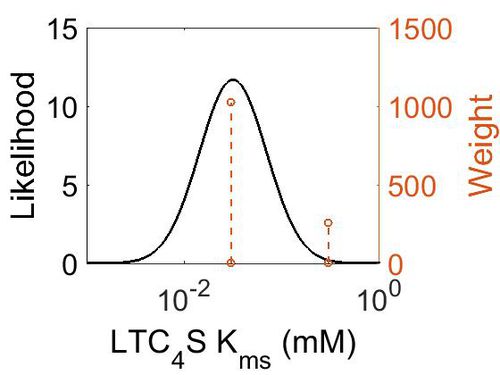
Kms
| Value | Units | Species | Notes | Weight | Reference |
|---|---|---|---|---|---|
| 0.3 ± 0.06 | mM | Human | Expression Vector: E. Coli.
Enzyme: Wild Type hLTC4S pH:7.8 Temperature:20 °C |
256 | [1] |
| 3.00E-02 ± 1.00E-02 | mM | Human | Expression Vector: E Coli
Enzyme: Wild type LTC4S pH: 7.8 Temperature: 37 °C |
1024 | [2] |
| Mode (mM) | Confidence Interval | Location parameter (µ) | Scale parameter (σ) |
|---|---|---|---|
| 3.15E-02 | 7.18E+00 | -2.83E+00 | 7.90E-01 |
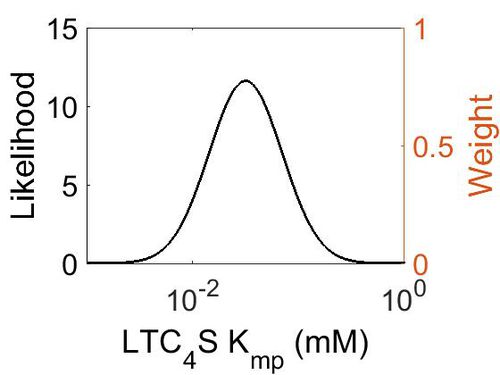
Kmp
| Mode (mM) | Location parameter (µ) | Scale parameter (σ) |
|---|---|---|
| 3.18E-02 | -2.82E+00 | 7.92E-01 |
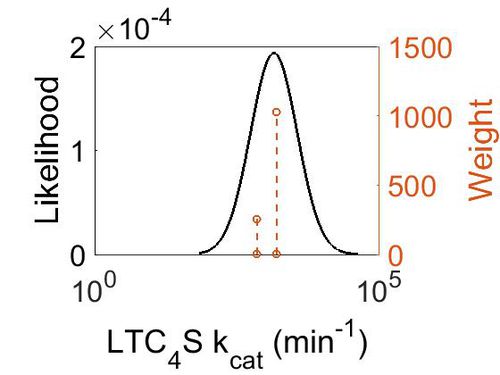
kcat
| Value | Units | Species | Notes | Weight | Reference |
|---|---|---|---|---|---|
| 702 | per minute | Human | Expression Vector: E. Coli.
Enzyme: Wild Type hLTC4S pH:7.8 Temperature:20 °C |
256 | [1] |
| 1560 ± 240 | per minute | Human | Expression Vector: E Coli
Enzyme: Wild type LTC4S pH: 7.8 Temperature: 37 °C |
1024 | [2] |
| Mode (min-1) | Confidence Interval | Location parameter (µ) | Scale parameter (σ) |
|---|---|---|---|
| 1.47E+03 | 1.42E+00 | 7.40E+00 | 3.29E-01 |
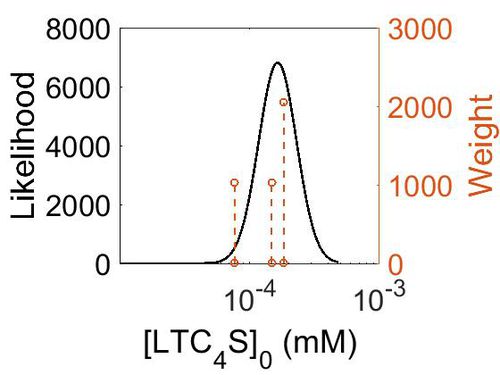
Enzyme concentration
To convert the enzyme concentration from ppm to mM, the following equation was used.
| Value | Units | Species | Notes | Weight | Reference |
|---|---|---|---|---|---|
| 26.8 | 
|
Human | Expression Vector: Lung
Enzyme: LTC4S pH: 7.5 Temperature: 37 °C |
1024 | [3] |
| 33.0 | 
|
Human | Expression Vector: Esophagus
Enzyme: LTC4S pH: 7.5 Temperature: 37 °C |
2048 | [3] |
| 13.9 | 
|
Human | Expression Vector: Adrenal Gland
Enzyme: LTC4S pH: 7.5 Temperature: 37 °C |
1024 | [3] |
| Mode (mM) | Mode (ppm) | Confidence Interval | Location parameter (µ) | Scale parameter (σ) |
|---|---|---|---|---|
| 2.90E+01 | 1.60E-04 | 1.44E+00 | 3.49E+00 | 3.46E-01 |
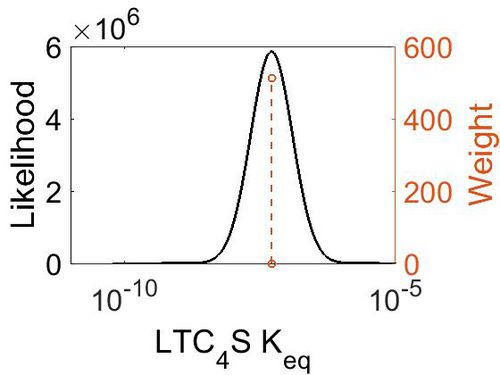
Keq
| Gibbs Free Energy Change | Units | Species | Notes | Weight | Reference |
|---|---|---|---|---|---|
| 9.934128 | kcal/mol | Not stated | Estimated
Enzyme: LTC4S Substrate: LTA4 Product: LTC4 pH: 7.3 ionic strength: 0.25 |
64 | [4] |
| Mode (mM) | Confidence Interval | Location parameter (µ) | Scale parameter (σ) |
|---|---|---|---|
| 5.13E-08 | 1.00E+01 | -1.60E+01 | 8.90E-01 |
Related Reactions
References
- ↑ 1.0 1.1 [http://www.jbc.org/content/285/52/40771.full.pdf Rinaldo A. " Arginine 104 Is a Key Catalytic Residue in Leukotriene C4 Synthase J Biochem 2010, 285, 40771-40776]
- ↑ 2.0 2.1 Niegowski D. " Crystal structures of Leukotriene C4 synthase in complex with product analogs, implications for the enzyme mechanism J. Biol. Chem. 289, 5199-5207 (2014)
- ↑ 3.0 3.1 3.2 M. Kim A draft map of the human proteome Nature, 2014 509, 575–581
- ↑ Caspi et al 2014, "The MetaCyc database of metabolic pathways and enzymes and the BioCyc collection of Pathway/Genome Databases," Nucleic Acids Research 42:D459-D471

