Difference between revisions of "Formation of homo-dimer R2"
(→Parameters) |
(→Parameters) |
||
| Line 36: | Line 36: | ||
|- | |- | ||
|<math>k^{-}_{6}</math> | |<math>k^{-}_{6}</math> | ||
| − | |<math> | + | |<math>2.12-6.84</math> <ref name="Janin1997"> [http://onlinelibrary.wiley.com/doi/10.1002/(SICI)1097-0134(199706)28:2%3C153::AID-PROT4%3E3.0.CO;2-G/epdf Janin, Joel. ''The kinetics of protein-protein recognition.'' Proteins-Structure Function and Bioinformatics (1997): 153-161.]</ref> <ref name="Northrup1992"> [http://www.pnas.org/content/89/8/3338.full.pdf Northrup S.H. and Erickson H.P. ''Kinetics of protein-protein association explained by Brownian dynamics computer simulation.''PNAS 1992;89(8),3338-3342]</ref> |
|<math>min^{-1}</math> | |<math>min^{-1}</math> | ||
| N/A | | N/A | ||
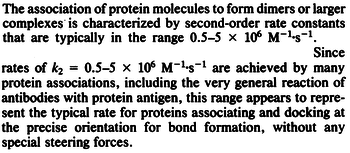
| − | |According to Northrup et al. the <math>K_{a}</math> of protein-protein bond formations occur in the order of <math>10^{6} M^{-1}s^{-1}</math>. Therefore, this value is used to calculate the dissociation rate for the ScbR homo-dimer formation. Therefore the range of the <math>k^{-}_{3}</math> values is calculated as per <math>k^{-}_{6}=K_{d6} \cdot K_{a}</math>. | + | |According to Northrup et al. the <math>K_{a}</math> of protein-protein bond formations occur in the order of <math>10^{6} M^{-1}s^{-1}</math>. Therefore, this value is used to calculate the dissociation rate for the ScbR homo-dimer formation. Therefore the range of the <math>k^{-}_{3}</math> values is <math>2.12-6.84 min^{-1}</math>, calculated as per <math>k^{-}_{6}=K_{d6} \cdot K_{a}</math>. |
[[Image:K3-text.png|center|thumb|350px|Northrup et al. 1992<ref name="Northrup1992"></ref>]] | [[Image:K3-text.png|center|thumb|350px|Northrup et al. 1992<ref name="Northrup1992"></ref>]] | ||
|} | |} | ||
Revision as of 19:25, 15 October 2015
Two ScbR (R) proteins bind together to form an ScbR homo-dimer (R2).
Contents
Chemical equation

Rate equation
![r= \frac{k^{-}_{6}}{K_{d6}}\cdot [R]^{2} - k^{-}_{6}\cdot [R_{2}]](/wiki/images/math/b/d/2/bd256ae2f0b0944a1e29766d6d3329ee.png)
Parameters
The parameters of this reaction are the dissociation constant for binding of one ScbR to another ( ) and the dissociation rate for binding of one ScbR to another (
 ).
).
| Name | Value | Units | Value in previous GBL models | Remarks-Reference |
|---|---|---|---|---|

|
 [1] [1]
|

|
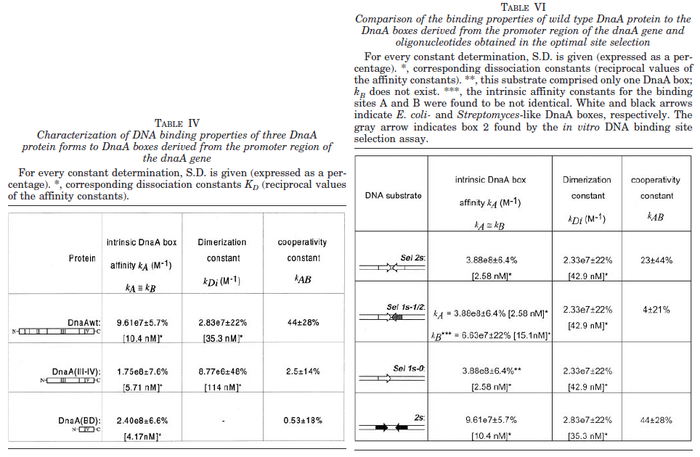
N/A | Majka et al. published a study on dimerization of the initiator Protein DnaA of Streptomyces and on its mutants, where they report dissociation constants in the range  . .
 Majka et al. 2001[1] These values agree with Ozbabacan et al. [2] who state that strong protein-protein interactions such as homodimerization have equilibrium dissociation constants |

|
 [3] [4] [3] [4]
|

|
N/A | According to Northrup et al. the  of protein-protein bond formations occur in the order of of protein-protein bond formations occur in the order of  . Therefore, this value is used to calculate the dissociation rate for the ScbR homo-dimer formation. Therefore the range of the . Therefore, this value is used to calculate the dissociation rate for the ScbR homo-dimer formation. Therefore the range of the  values is values is  , calculated as per , calculated as per  . .
 Northrup et al. 1992[4] |
Parameters with uncertainty
The probability distributions, adjusted accordingly in order to reflect the above values, are the following:
The most plausible parameter value for the  is decided to be
  and the confidence interval
  . This means that the mode of the PDF is
  and the range where 95% of the values are found is between
  and
and  .
.
In a similar way, the most plausible value for  is
is  and the confidence interval 10. This means that the mode of the PDF is
  and the range where 95% of the values are found is between
  and
and 
 .
.
The probability distributions for the two parameters, adjusted accordingly in order to reflect the above values, are the following:
The location and scale parameters of the distributions are:
| Parameter | μ | σ |
|---|---|---|

|

|

|

|

|

|
References
- ↑ 1.0 1.1 Majka J, Zakrzewska-Czerwiñska J, Messer W. Sequence recognition, cooperative interaction, and dimerization of the initiator protein DnaA of Streptomyces. J Biol Chem. 2001;276(9):6243-52.
- ↑ Saliha Ece Acuner Ozbabacan, Hatice Billur Engin, Attila Gursoy, and Ozlem Keskin. Transient protein–protein interactions. Protein Engineering, Design and Selection first published online June 15, 2011
- ↑ Janin, Joel. The kinetics of protein-protein recognition. Proteins-Structure Function and Bioinformatics (1997): 153-161.
- ↑ 4.0 4.1 Northrup S.H. and Erickson H.P. Kinetics of protein-protein association explained by Brownian dynamics computer simulation.PNAS 1992;89(8),3338-3342


 and mostly in the nanomolar range.