Formation of homo-dimer R2
Two ScbR (R) proteins bind together to form an ScbR homo-dimer (R2).


Contents
Chemical equation

Rate equation
![r= \frac{k^{-}_{6}}{K_{d6}}\cdot [R]^{2} - k^{-}_{6}\cdot [R_{2}]](/wiki/images/math/b/d/2/bd256ae2f0b0944a1e29766d6d3329ee.png)
Parameters
The parameters of this reaction are the dissociation constant for binding of one ScbR to another ( ) and the dissociation rate for binding of one ScbR to another (
 ).
).
| Name | Value | Units | Value in previous GBL models [1] [2] | Remarks-Reference |
|---|---|---|---|---|
|
|
 [3] [3]
|

|
N/A | Majka et al. published a study on dimerization of the initiator Protein DnaA of Streptomyces and on its mutants, where they report dissociation constants in the range  . .
 Majka et al. 2001[3] These values agree with Ozbabacan et al. [4] and Nooren et al. [5] who state that strong protein-protein interactions such as homodimerization have equilibrium dissociation constants |
|
|
 [6] [7] [6] [7]
|

|
N/A | According to Northrup et al. the  of protein-protein bond formations occur in the order of of protein-protein bond formations occur in the order of  . .
 Northrup et al. 1992[7] Additionally, according to Ozbabacan et al. the binding rates can reach  Ozbabacan et al. 2011[4] Therefore, the range Afterwards, the log-normal distribution for the dissociation rate |
 and mostly in the nanomolar range.
As the protein homodimer is quite stable, we will focus more on the lower
and mostly in the nanomolar range.
As the protein homodimer is quite stable, we will focus more on the lower  values (<43nM).
 in fast binding reactions.
 is used to generate the probability distribution of
 Parameters with uncertainty
When deciding how to describe the uncertainty for this parameter we must take into consideration that the values reported in literature correspond to in vitro testing of different protein-protein interaction and dimerization reactions than ScbR, although they refer to another Streptomyces protein (DnaA). This means that there might be a difference between actual parameter values and the ones reported in literature. These facts influence the quantification of the parameter uncertainty and therefore the shape of the corresponding distributions. By assigning the appropriate weights to the parameter values and using the method described here, the appropriate probability distributions were designed.
More specifically, for the mode of the log-normal distribution is  (value that is close to the wild type protein homodimerization). However, in order to explore sa larger part of the nanomolar scale when sampling for parameter values, the Spread is calculated to be
  . In this way, the range where 68.27% of the values are found is between
  and
and  .
.
With regards to the parameter  , in order to explore the full range of plausible values, the mode of the log-normal distribution is set to
  and the Spread is
  . Thus the range where 68.27% of the values are found is between
  and
and 
 .
.
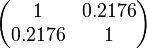
Since the two parameters are interdependent, thermodynamic consistency also needs to be taken into account. This is achieved by creating a bivariate system as described here. Since no information was retrieved for and therefore is the parameter with the largest geometric coefficient of variation, this is set as the dependent parameter as per: 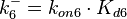 . The location and scale parameters of (μ=2.5303 and σ=1.5324) were calculated from those of and .
The probability distributions for the two parameters, adjusted accordingly in order to reflect the above values, are the following:


The values retrieved from literature and their weights are indicated by the blue dashed lines, and the uncertainty for each value is indicated using the reported experimental error (green lines) or a default value of 10% error (orange lines). The correlation matrix which is necessary to define the relationship between the two marginal distributions ( ,) of the bivariate system is derived by employing random values generated by the two distributions.
The parameter information of the distributions of the multivariate system is:
| Parameter | Mode | Spread | μ | σ | Correlation matrix |
|---|---|---|---|---|---|
|
|

|
|

|

|
N/A |
|
|

|
|

|

|
|
|
|
N/A | N/A | 
|

|
The multivariate system of the normal distributions ( and
and  ) and the resulting samples of values are presented in the following figure:

In this way, a system of distributions is created where each distribution is described and constrained by the other two. Therefore, the parameters will be sampled by the two marginal distributions in a way consistent with our beliefs and with the relevant thermodynamic constraints.
References
- ↑ S. Mehra, S. Charaniya, E. Takano, and W.-S. Hu. A bistable gene switch for antibiotic biosynthesis: The butyrolactone regulon in streptomyces coelicolor. PLoS ONE, 3(7), 2008.
- ↑ A. Chatterjee, L. Drews, S. Mehra, E. Takano, Y.N. Kaznessis, and W.-S. Hu. Convergent transcription in the butyrolactone regulon in streptomyces coelicolor confers a bistable genetic switch for antibiotic biosynthesis. PLoS ONE, 6(7), 2011.
- ↑ 3.0 3.1 Majka J, Zakrzewska-Czerwiñska J, Messer W. Sequence recognition, cooperative interaction, and dimerization of the initiator protein DnaA of Streptomyces. J Biol Chem. 2001;276(9):6243-52.
- ↑ 4.0 4.1 Saliha Ece Acuner Ozbabacan, Hatice Billur Engin, Attila Gursoy, and Ozlem Keskin. Transient protein–protein interactions. Protein Engineering, Design and Selection first published online June 15, 2011
- ↑ Irene M.A Nooren, Janet M. Thornton. Structural Characterisation and Functional Significance of Transient Protein–Protein Interactions Journal of Molecular Biology 2003;325(5)
- ↑ Janin, Joel. The kinetics of protein-protein recognition. Proteins-Structure Function and Bioinformatics (1997): 153-161.
- ↑ 7.0 7.1 Northrup S.H. and Erickson H.P. Kinetics of protein-protein association explained by Brownian dynamics computer simulation.PNAS 1992;89(8),3338-3342