Difference between revisions of "Degradation of C2-R2"
(Created page with "The SCB1-ScbR protein complex (C<sub>2</sub>R<sub>2</sub>) degrades. <imagemap> Image:Back button.png|150px|right|alt=Go back to overview default Welcome to the In-Silico M...") |
(→Parameters) |
||
| (24 intermediate revisions by the same user not shown) | |||
| Line 1: | Line 1: | ||
| − | The | + | {{DISPLAYTITLE: Degradation of C<sub>2</sub>-R<sub>2</sub>}} |
| + | The SCB-ScbR protein complex (C<sub>2</sub>-R<sub>2</sub>) degrades. | ||
<imagemap> | <imagemap> | ||
Image:Back button.png|150px|right|alt=Go back to overview | Image:Back button.png|150px|right|alt=Go back to overview | ||
| Line 7: | Line 8: | ||
==Chemical equation== | ==Chemical equation== | ||
| − | <center><math>C_{2}R_{2}\rightarrow \varnothing</math></center> | + | <center><math>C_{2}-R_{2}\rightarrow \varnothing</math></center> |
== Rate equation == | == Rate equation == | ||
| − | <center><math> r= d_{CR}\cdot[C_{2}R_{2}]</math></center> | + | <center><math> r= d_{CR}\cdot[C_{2}-R_{2}]</math></center> |
== Parameters == | == Parameters == | ||
| − | The parameter of this reaction is the degradation rate of C<sub>2</sub>R<sub>2</sub> (<math>d_{CR}</math>). | + | The parameter of this reaction is the degradation rate of C<sub>2</sub>-R<sub>2</sub> (<math>d_{CR}</math>). The parameter values were derived from proteomics studies on different proteins of ''S. coelicolor''. |
| − | {|class="wikitable" | + | {|class="wikitable" |
! Name | ! Name | ||
! Value | ! Value | ||
! Units | ! Units | ||
| − | ! | + | ! Value in previous GBL models <ref name="Mehra2008"> [http://www.plosone.org/article/fetchObject.action?uri=info:doi/10.1371/journal.pone.0002724&representation=PDF S. Mehra, S. Charaniya, E. Takano, and W.-S. Hu. ''A bistable gene switch for antibiotic biosynthesis: The butyrolactone regulon in streptomyces coelicolor.'' PLoS ONE, 3(7), 2008.] </ref> <ref name="Chatterjee2011"> [http://www.plosone.org/article/fetchObject.action?uri=info:doi/10.1371/journal.pone.0021974&representation=PDF A. Chatterjee, L. Drews, S. Mehra, E. Takano, Y.N. Kaznessis, and W.-S. Hu. ''Convergent transcription in the butyrolactone regulon in streptomyces coelicolor confers a bistable genetic switch for antibiotic biosynthesis.'' PLoS ONE, 6(7), 2011.] </ref> |
| − | ! Remarks | + | ! Remarks-Reference |
|- | |- | ||
|<math>d_{CR}</math> | |<math>d_{CR}</math> | ||
| − | |<math> | + | |<math>5.02 \cdot 10^{-4}- 0.00578 min^{-1}</math> <ref name="Trötschel2013"> [http://www.ncbi.nlm.nih.gov/pmc/articles/PMC3815937/pdf/mbt0006-0708.pdf Trötschel C, Albaum SP, Poetsch A. ''Proteome turnover in bacteria: current status for Corynebacterium glutamicum and related bacteria.'' Microbial biotechnology. 2013;6(6):708-719.]</ref> <ref name="Jayapal2010"> [http://pubs.acs.org/doi/pdf/10.1021/pr9007738 Jayapal KP, Sui S, Philp RJ, Kok YJ, Yap MG, Griffin TJ, Hu WS. ''Multitagging proteomic strategy to estimate protein turnover rates in dynamic systems.'' J Proteome Res. 2010 May 7;9(5):2087-97.]</ref> <ref name="Mosteller1980"> [http://www.jbc.org/content/255/6/2524.full.pdf Mosteller RD, Goldstein RV, Nishimoto KR. ''Metabolism of individual proteins in exponentially growing Escherichia coli.'' J Biol Chem. 1980 Mar 25;255(6):2524-32]</ref> |
| − | | <math>min^{-1}</math> | + | |<math> min^{-1} </math> |
| − | | | + | |<math>0.062 s^{-1} (3.72 min^{-1})</math><ref name="Mehra2008"></ref> |
| − | + | <math>0.0031 s^{-1} (0.186 min^{-1})</math><ref name="Chatterjee2011"></ref> | |
| − | | | + | |
| + | Range tested: <math>10^{-7}-10^{-1} s^{-1}</math> | ||
| + | |||
| + | (<math>6 \cdot 10^{-6}-6 min^{-1}</math>) | ||
| + | |||
| + | Bistability range: <math>0.061-0.17 s^{-1}</math><ref name="Mehra2008"></ref> | ||
| + | |||
| + | (<math>3.66-10.2 min^{-1}</math>) | ||
| + | |||
| + | and <math>0.0031-0.068 s^{-1}</math><ref name="Chatterjee2011"></ref> | ||
| + | |||
| + | (<math>0.186-4.08 min^{-1}</math>) | ||
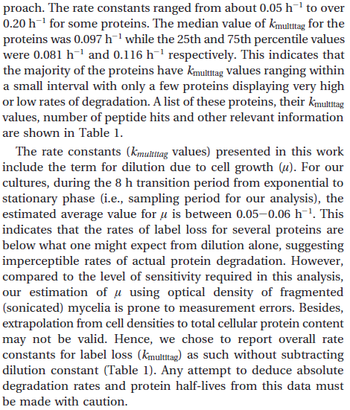
| + | |In a quantitative proteomics study on protein turnover rates in dynamic systems, Jayapal et al. reported the degradation rates of 115 proteins in ''S. coelicolor'' cultures undergoing transition from exponential growth to stationary phase. The values were in the range <math>0.05 \pm 0.014 h^{-1} -0.223 \pm 0.031 h^{-1} (8.3 \pm 2.3 \cdot 10^{-4}-0.0037 \pm 0.00052 min^{-1}) </math> with a median of <math>0.097 h^{-1} (0.00162 min^{-1})</math>. | ||
| + | [[Image:DR-text.png|center|thumb|350px|Jayapal et al. 2012<ref name="Jayapal2010"></ref>]] | ||
| + | |||
| + | The full list of the proteins studied and their turnover rate constants can be found [http://kirschner.med.harvard.edu/files/bionumbers/List%20of%20Proteins%20Examined%20and%20Their%20Turnover%20Rate%20Constants.pdf here]. | ||
| + | |||
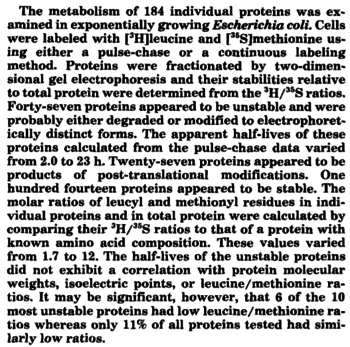
| + | Additionally, an ''in vivo'' study examining the stability of 184 proteins in growing and non-growing ''E. coli''<ref name="Mosteller1980"></ref> reported 47 proteins that degraded within 24 hours, while the rest were either modified (27) or were found to be stable (114). The values measured were in the range <math>5.02 \cdot 10^{-4} - | ||
| + | 0.00578 min^{-1}</math> | ||
| + | |||
| + | [[Image:DR-text2.png|center|thumb|350px|Mosteller et al. 2012<ref name="Mosteller1980"></ref>]] | ||
|} | |} | ||
==Parameters with uncertainty== | ==Parameters with uncertainty== | ||
| − | The | + | When deciding how to describe the uncertainty for this parameter we must take into consideration that the reported values are estimated or calculated from proteomics experiments, using methods which were prone to measurement errors (i.e. optical density of fragmented mycelia to estimate the growth rate (''μ'')) and extrapolations from cell density to total cellular protein without taking into account the dilution due to cell division. Additionally, the study did not include measurements on protein complexes, although it was conducted on a wide range of ''S. coelicolor'' proteins which enables a rough estimation of the range of values of protein degradation in this species. These facts influence the quantification of the parameter uncertainty and therefore the shape of the corresponding distribution. By assigning the appropriate weights to the parameter values and using the method described [[Quantification of parameter uncertainty#Design of probability distributions|'''here''']], the appropriate probability distribution was designed. |
| + | |||
| + | The mode of the log-normal distribution of the <math>d_{CR}</math> to <math> 0.00144 min^{-1} </math>. In order to explore the full range of published values and even sample a percentage of values outside the reported range, the Spread is set to <math> 1.78 </math>, so that the range where 68.27% of the values are found is between <math>8\cdot 10^{-4}</math> and <math>0.0026 min^{-1}</math>. | ||
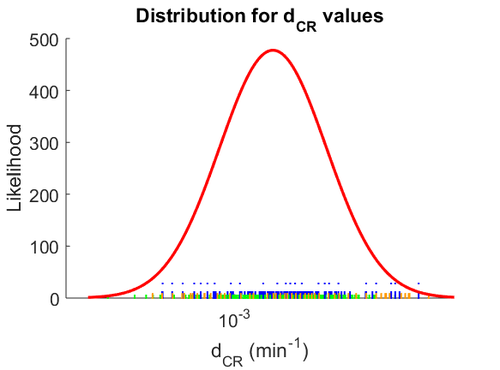
The probability distribution for the parameter, adjusted accordingly in order to reflect the above values, is the following: | The probability distribution for the parameter, adjusted accordingly in order to reflect the above values, is the following: | ||
| Line 40: | Line 63: | ||
[[Image:DCR.png|500px]] | [[Image:DCR.png|500px]] | ||
| − | The | + | The values retrieved from literature and their weights are indicated by the blue dashed lines, and the uncertainty for each value is indicated using the reported experimental error (green lines) or a default value of 10% error (orange lines). |
| + | |||
| + | The parameter information of the distribution is: | ||
{|class="wikitable" | {|class="wikitable" | ||
! Parameter | ! Parameter | ||
| + | ! Mode | ||
| + | ! Spread | ||
! μ | ! μ | ||
! σ | ! σ | ||
|- | |- | ||
|<math>d_{CR}</math> | |<math>d_{CR}</math> | ||
| − | |<math>-6. | + | |<math>0.00144</math> |
| − | |<math>0. | + | |<math>1.78</math> |
| + | |<math>-6.2837</math> | ||
| + | |<math>0.50981</math> | ||
|} | |} | ||
==References== | ==References== | ||
<references/> | <references/> | ||
Latest revision as of 18:03, 4 January 2018
The SCB-ScbR protein complex (C2-R2) degrades.
Contents
Chemical equation

Rate equation
![r= d_{CR}\cdot[C_{2}-R_{2}]](/wiki/images/math/0/0/b/00b0af37b185dcb7094f942404631e79.png)
Parameters
The parameter of this reaction is the degradation rate of C2-R2 ( ). The parameter values were derived from proteomics studies on different proteins of S. coelicolor.
| Name | Value | Units | Value in previous GBL models [1] [2] | Remarks-Reference |
|---|---|---|---|---|

|
 [3] [4] [5] [3] [4] [5]
|

|
 [1] [1]
Range tested: ( Bistability range: ( and ( |
In a quantitative proteomics study on protein turnover rates in dynamic systems, Jayapal et al. reported the degradation rates of 115 proteins in S. coelicolor cultures undergoing transition from exponential growth to stationary phase. The values were in the range  with a median of with a median of  . .
 Jayapal et al. 2012[4] The full list of the proteins studied and their turnover rate constants can be found here. Additionally, an in vivo study examining the stability of 184 proteins in growing and non-growing E. coli[5] reported 47 proteins that degraded within 24 hours, while the rest were either modified (27) or were found to be stable (114). The values measured were in the range  Mosteller et al. 2012[5] |
Parameters with uncertainty
When deciding how to describe the uncertainty for this parameter we must take into consideration that the reported values are estimated or calculated from proteomics experiments, using methods which were prone to measurement errors (i.e. optical density of fragmented mycelia to estimate the growth rate (μ)) and extrapolations from cell density to total cellular protein without taking into account the dilution due to cell division. Additionally, the study did not include measurements on protein complexes, although it was conducted on a wide range of S. coelicolor proteins which enables a rough estimation of the range of values of protein degradation in this species. These facts influence the quantification of the parameter uncertainty and therefore the shape of the corresponding distribution. By assigning the appropriate weights to the parameter values and using the method described here, the appropriate probability distribution was designed.
The mode of the log-normal distribution of the  to
to  . In order to explore the full range of published values and even sample a percentage of values outside the reported range, the Spread is set to
  , so that the range where 68.27% of the values are found is between
  and
and  .
.
The probability distribution for the parameter, adjusted accordingly in order to reflect the above values, is the following:
The values retrieved from literature and their weights are indicated by the blue dashed lines, and the uncertainty for each value is indicated using the reported experimental error (green lines) or a default value of 10% error (orange lines).
The parameter information of the distribution is:
| Parameter | Mode | Spread | μ | σ |
|---|---|---|---|---|

|

|

|

|

|
References
- ↑ 1.0 1.1 1.2 S. Mehra, S. Charaniya, E. Takano, and W.-S. Hu. A bistable gene switch for antibiotic biosynthesis: The butyrolactone regulon in streptomyces coelicolor. PLoS ONE, 3(7), 2008.
- ↑ 2.0 2.1 2.2 A. Chatterjee, L. Drews, S. Mehra, E. Takano, Y.N. Kaznessis, and W.-S. Hu. Convergent transcription in the butyrolactone regulon in streptomyces coelicolor confers a bistable genetic switch for antibiotic biosynthesis. PLoS ONE, 6(7), 2011.
- ↑ Trötschel C, Albaum SP, Poetsch A. Proteome turnover in bacteria: current status for Corynebacterium glutamicum and related bacteria. Microbial biotechnology. 2013;6(6):708-719.
- ↑ 4.0 4.1 Jayapal KP, Sui S, Philp RJ, Kok YJ, Yap MG, Griffin TJ, Hu WS. Multitagging proteomic strategy to estimate protein turnover rates in dynamic systems. J Proteome Res. 2010 May 7;9(5):2087-97.
- ↑ 5.0 5.1 5.2 Mosteller RD, Goldstein RV, Nishimoto KR. Metabolism of individual proteins in exponentially growing Escherichia coli. J Biol Chem. 1980 Mar 25;255(6):2524-32


 )
)

 )
)

 )
)
