Difference between revisions of "Cellular growth"
(→Dynamics of bacterial colony growth) |
(→Dynamics of bacterial colony growth) |
||
| Line 81: | Line 81: | ||
With regards to the effect of the cell volume of individual cells on the diffusion rate of the autoinducer, the coefficient <math>r</math> which contributes to the diffusion of the external autoinducer into the cells, is described by the equation | With regards to the effect of the cell volume of individual cells on the diffusion rate of the autoinducer, the coefficient <math>r</math> which contributes to the diffusion of the external autoinducer into the cells, is described by the equation | ||
| − | <center><math> | + | <center><math>\rho_{i}(t)= \frac{V_{c,i}(t)}{V_{tot}- \displaystyle\sum_{j=1}^{N}V_{c,j}(t)}= \frac{V_{c,i}(t)}{V_ext} </math>.</center> |
The duration of the cell cycle, <math>τ_{i}</math>, is different for each cell and is set independently after a division according to the stochastic rule <ref name="Xandri2010"> [http://www.ncbi.nlm.nih.gov/pmc/articles/PMC2877355/pdf/main.pdf Canela-Xandri O, Sagues F, Buceta J. ''Interplay between intrinsic noise and the stochasticity of the cell cycle in bacterial colonies.'' Biophys J 2010, 98(11):2459–68.]</ref> | The duration of the cell cycle, <math>τ_{i}</math>, is different for each cell and is set independently after a division according to the stochastic rule <ref name="Xandri2010"> [http://www.ncbi.nlm.nih.gov/pmc/articles/PMC2877355/pdf/main.pdf Canela-Xandri O, Sagues F, Buceta J. ''Interplay between intrinsic noise and the stochasticity of the cell cycle in bacterial colonies.'' Biophys J 2010, 98(11):2459–68.]</ref> | ||
<center><math>τ_{i}=λ\cdot τ+ (1-λ)\cdot \tilde{τ}</math>,</center> | <center><math>τ_{i}=λ\cdot τ+ (1-λ)\cdot \tilde{τ}</math>,</center> | ||
where <math>τ</math> and <math>\tilde{τ}</math> correspond to the deterministic and stochastic parameters of the cell cycle duration respectively, and <math>λ \in [0, 1] </math> is a parameter that weights their relative importance.The stochastic component accounts for the period of time between events described by a Poissonian process according to an exponential distribution, | where <math>τ</math> and <math>\tilde{τ}</math> correspond to the deterministic and stochastic parameters of the cell cycle duration respectively, and <math>λ \in [0, 1] </math> is a parameter that weights their relative importance.The stochastic component accounts for the period of time between events described by a Poissonian process according to an exponential distribution, | ||
| − | <center><math> | + | <center><math>\phi(\tilde{τ})=\frac{e^{-\frac{\tilde{τ}}{τ}}}{τ}</math>.</center> |
In this way, variability is enabled from cell to cell with regards to the duration of the cell cycle, yet a minimum cell cycle duration <math>λ\cdot τ</math> is set. Therefore, the average duration and standard deviation of the cell cycle are <math>τ</math> and <math>(1 − λ) \cdot τ</math> respectively. <ref name="Weber2013"> [http://www.biomedcentral.com/content/pdf/1752-0509-7-6.pdf M. Weber and J. Buceta. ''Dynamics of the quorum sensing switch: Stochastic and non-stationary effects.'' BMC Systems Biology 2013,(7):6]</ref> | In this way, variability is enabled from cell to cell with regards to the duration of the cell cycle, yet a minimum cell cycle duration <math>λ\cdot τ</math> is set. Therefore, the average duration and standard deviation of the cell cycle are <math>τ</math> and <math>(1 − λ) \cdot τ</math> respectively. <ref name="Weber2013"> [http://www.biomedcentral.com/content/pdf/1752-0509-7-6.pdf M. Weber and J. Buceta. ''Dynamics of the quorum sensing switch: Stochastic and non-stationary effects.'' BMC Systems Biology 2013,(7):6]</ref> | ||
Revision as of 12:33, 27 November 2017


Our simulations include hours of cell culture growth in some cases (simulated experimental time, not computational time). Thus, in addition to the dynamics of the regulatory network, we also need to take into account the effects of cell growth. The volume of a single cell is increasing from the beginning of the cell cycle until the moment it divides into two daughter cells and the molecules included in the initial cell are distributed between the two new ones. As a consequence, the cellular growth introduces a dilution in the concentration of the cellular species, which is represented in our deterministic model by adding a dilution term  in the
Ordinary Differential Equations (ODEs) of all species, with the exception of the autoinducer in the environment
in the
Ordinary Differential Equations (ODEs) of all species, with the exception of the autoinducer in the environment  .
.
Contents
Parameters
The growth rate of the cells is represented by the parameter Failed to parse (PNG conversion failed; check for correct installation of latex and dvipng (or dvips + gs + convert)): μ . The parameter values were derived from published data on S. coelicolor growth rate under different environmental conditions. In order to avoid infinitely slow or fast culture growth and also in order to maintain consistency with the stochastic model, doubling times (τ) rather than growth rates will be employed in the simulations.
| Name | Value | Units | Value in previous GBL models [1] [2] | Remarks-Reference |
|---|---|---|---|---|
| Failed to parse (PNG conversion failed; check for correct installation of latex and dvipng (or dvips + gs + convert)): τ |  [3][4] [5] [3][4] [5]
|

|
 [1] [1]
Range tested: ( Bistability range: ( and ( |
In a study on comparison between turbimetric and gravimetric techniques for the measurements of specific growth rates of streptomycetes, Flowers et al. reported growth rate values in the range of  . The reported doubling times were in the range of . The reported doubling times were in the range of  . .
 Flowers et al. 1977[3] Additionally, Melzoch et al. studied the observed growth rates of S. coelicolor in variously limited chemostat cultures and reported a maximum growth rate of  Melzoch et al. 1997[5] These values are comparable with the findings of R.A. Cox, who reported genomic properties and macromolecular compositions of Streptomyces coelicolor A3(2). The largest growth rate was  Cox et al. 2004[4] |


 )
)
 )
)

 . He noted that the maximum specific growth rate, is attained when cells are amply supplied with the most favourable nutrients.
Parameters with uncertainty
When deciding how to describe the uncertainty for this parameter we must take into consideration that some of the parameters were calculated or estimated based on experimental data on S. coelicolor cultures, so there might be some error included in the estimations. Additionally, since the simulations will investigate the switch which regulates antibiotic production in S. coelicolor, it would be preferable to be as close as possible to the growth rate which facilitates this process. These facts influence the quantification of the parameter uncertainty and therefore the shape of the corresponding distribution. By assigning the appropriate weights to the parameter values and using the method described here, the appropriate probability distribution was designed.
In order to keep the parameter values as strictly as possible within the range of the values reported in literature, the prediction interval in this case for the definition of the distribution is set to 95.45% rather than 68.27%. Thus, the weight of the distribution will be put to Failed to parse (Cannot store math image on filesystem.): 99.3 min which is also set as the mode of the log-normal distribution for the Failed to parse (PNG conversion failed; check for correct installation of latex and dvipng (or dvips + gs + convert)): μ and the Spread is set to Failed to parse (Cannot store math image on filesystem.): 1.74 , in order to test the system's behaviour under the full range of reported values. This means that the range where 95.45% of the parameter values are found is between Failed to parse (Cannot store math image on filesystem.): 57 and Failed to parse (Cannot store math image on filesystem.): 172.8 min .
The probability distribution for the parameter, adjusted accordingly in order to reflect the above values, is the following:
The values retrieved from literature and their weights are indicated by the blue dashed lines, and the uncertainty for each value is indicated using a default value of 10% error (orange lines).
The parameter information of the distribution is:
| Parameter | Mode | Spread | μ | σ |
|---|---|---|---|---|
| Failed to parse (PNG conversion failed; check for correct installation of latex and dvipng (or dvips + gs + convert)): τ | Failed to parse (Cannot store math image on filesystem.): 99.3 | 
|
Failed to parse (Cannot store math image on filesystem.): 4.6699 | Failed to parse (Cannot store math image on filesystem.): 0.26762 |
Dynamics of bacterial colony growth
For our simulations we assume that cells are maintained in the exponential phase with doubling time Failed to parse (PNG conversion failed; check for correct installation of latex and dvipng (or dvips + gs + convert)): τ . In our virtual colony, each individual cell grows exponentially in time until its division into two daughter cells, as per
 ,
,where  is the volume of a cell at the beginning of the cell cycle (same for all cells),
  is the duration of the cell cycle of cell i, and t is the time to the precedent division event. When
  the cell i has doubled its volume and a new division takes place. At this timepoint the internal clocks and volumes of the daughter cells are reset to zero and respectively. Moreover, when a cell divides, proteins, mRNAs and signalling molecules are binomially distributed [6] between daughter cells and one copy of the DNA is given to each cell. The regulatory complexes bound to the DNA are detached prior to the distribution between daughter cells. The total volume of the culture
  is constant and is composed by the volume of the total cells and the volume of the medium, as per the equation
  .
.

With regards to the effect of the cell volume of individual cells on the diffusion rate of the autoinducer, the coefficient  which contributes to the diffusion of the external autoinducer into the cells, is described by the equation
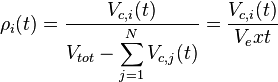 .
.The duration of the cell cycle, , is different for each cell and is set independently after a division according to the stochastic rule [7]
 ,
,where Failed to parse (PNG conversion failed; check for correct installation of latex and dvipng (or dvips + gs + convert)): τ
and  correspond to the deterministic and stochastic parameters of the cell cycle duration respectively, and
 ![λ \in [0, 1]](/wiki/images/math/f/6/8/f688a07dbc957d51711a57c647554943.png) is a parameter that weights their relative importance.The stochastic component accounts for the period of time between events described by a Poissonian process according to an exponential distribution,
is a parameter that weights their relative importance.The stochastic component accounts for the period of time between events described by a Poissonian process according to an exponential distribution,
 .
.In this way, variability is enabled from cell to cell with regards to the duration of the cell cycle, yet a minimum cell cycle duration  is set. Therefore, the average duration and standard deviation of the cell cycle are Failed to parse (PNG conversion failed; check for correct installation of latex and dvipng (or dvips + gs + convert)): τ
and
is set. Therefore, the average duration and standard deviation of the cell cycle are Failed to parse (PNG conversion failed; check for correct installation of latex and dvipng (or dvips + gs + convert)): τ
and  respectively. [8]
The values of the cell growth parameters that are used in the model are summarized in the following table:
| Name | Description | Value | Remarks-Reference |
|---|---|---|---|
| Failed to parse (PNG conversion failed; check for correct installation of latex and dvipng (or dvips + gs + convert)): τ | Cell cycle duration (doubling time) | 
|
The doubling time values are the ones reported in the section above. |
| Failed to parse (PNG conversion failed; check for correct installation of latex and dvipng (or dvips + gs + convert)): λ | relative weight between the det.-stoch.
parameters of the cell cycle |
 [6][9] [6][9]
|
Single cell level gene regulation studies in E. coli showed a difference of ~0.8 between single cell cycle duration and the mean cell cycle duration, due to periodic oscillations. |
|
|
cell volume at the beginning of cell cycle |  [4] [4]
|
The cell volume is derived by the publication of R.A. Cox (ref.  in the figure in Parameters section) where he reported the average cell volume for S. coelicolor A3(2) grown at 30 oC under different growth rates, between in the figure in Parameters section) where he reported the average cell volume for S. coelicolor A3(2) grown at 30 oC under different growth rates, between 
|
|
|
total cell culture volume | 
|
References
- ↑ 1.0 1.1 1.2 S. Mehra, S. Charaniya, E. Takano, and W.-S. Hu. A bistable gene switch for antibiotic biosynthesis: The butyrolactone regulon in streptomyces coelicolor. PLoS ONE, 3(7), 2008.
- ↑ 2.0 2.1 2.2 A. Chatterjee, L. Drews, S. Mehra, E. Takano, Y.N. Kaznessis, and W.-S. Hu. Convergent transcription in the butyrolactone regulon in streptomyces coelicolor confers a bistable genetic switch for antibiotic biosynthesis. PLoS ONE, 6(7), 2011.
- ↑ 3.0 3.1 Flowers TH, Williams ST. Measurement of growth rates of streptomycetes: comparison of turbidimetric and gravimetric techniques. J Gen Microbiol. 1977;98(1):285-9.
- ↑ 4.0 4.1 4.2 Cox RA. Quantitative relationships for specific growth rates and macromolecular compositions of Mycobacterium tuberculosis, Streptomyces coelicolor A3(2) and Escherichia coli B/r: an integrative theoretical approach. Microbiology. 2004 May;150(Pt 5):1413-26.
- ↑ 5.0 5.1 Melzoch K., Teixeira de Mattos M.J., Neijssel O.M. Production of actinorhodin by Streptomyces coelicolor A3(2) grown in chemostat culture. Biotechnology and Bioengineering 1997;54(6): p. 577–582
- ↑ 6.0 6.1 Rosenfeld N, Young JW, Alon U, Swain PS, Elowitz MB. Gene regulation at the single-cell level. Sci (New York, N.Y.) 2005, 307(5717):1962–5.
- ↑ Canela-Xandri O, Sagues F, Buceta J. Interplay between intrinsic noise and the stochasticity of the cell cycle in bacterial colonies. Biophys J 2010, 98(11):2459–68.
- ↑ M. Weber and J. Buceta. Dynamics of the quorum sensing switch: Stochastic and non-stationary effects. BMC Systems Biology 2013,(7):6
- ↑ Reshes G, Vanounou S, Fishov I, Feingold M: Timing the start of division in E. coli: a single-cell study. Phys Biol 2008, 5(4):046001.