Cellular growth


Our simulations include hours of cell culture growth in some cases (simulated experimental time, not computational time). Thus, in addition to the dynamics of the regulatory network, we also need to take into account the effects of cell growth. The volume of a single cell is increasing from the beginning of the cell cycle until the moment it divides into two daughter cells and the molecules included in the initial cell are distributed between the two new ones. As a consequence, the cellular growth introduces a dilution in the concentration of the cellular species, which is represented in our deterministic model by adding a dilution term  in the
Ordinary Differential Equations (ODEs) of all species, with the exception of the autoinducer in the environment
in the
Ordinary Differential Equations (ODEs) of all species, with the exception of the autoinducer in the environment  .
.
Parameters
The growth rate of the cells is represented by the parameter  . In our model, the number of cells is described by a six-parameter Baranyi–Roberts model. [1] [2]
In order to confirm that the estimated doubling time is realistic, we compared it to values derived from published data on S. coelicolor growth rate under different environmental conditions.
. In our model, the number of cells is described by a six-parameter Baranyi–Roberts model. [1] [2]
In order to confirm that the estimated doubling time is realistic, we compared it to values derived from published data on S. coelicolor growth rate under different environmental conditions.
| Name | Value | Units | Value in previous GBL models [3] [4] | Remarks-Reference |
|---|---|---|---|---|

|
 [5][6] [7] [5][6] [7]
|

|
 [3] [3]
Range tested: ( Bistability range: ( and ( |
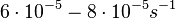
In a study on comparison between turbimetric and gravimetric techniques for the measurements of specific growth rates of streptomycetes, Flowers et al. reported growth rate values in the range of  . The reported doubling times were in the range of . The reported doubling times were in the range of  . .
 Flowers et al. 1977[5] Additionally, Melzoch et al. studied the observed growth rates of S. coelicolor in variously limited chemostat cultures and reported a maximum growth rate of  Melzoch et al. 1997[7] These values are comparable with the findings of R.A. Cox, who reported genomic properties and macromolecular compositions of Streptomyces coelicolor A3(2). The largest growth rate was  Cox et al. 2004[6] |


 )
)
 )
)

 . He noted that the maximum specific growth rate, is attained when cells are amply supplied with the most favourable nutrients.
Parameters with uncertainty
In our model, the number of cells is described by a six-parameter Baranyi–Roberts model[1][2] which takes into account the lag phase by using an adjustment function. In this model, the natural logarithm of the cell concentration is:
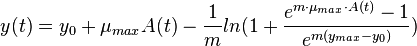
where 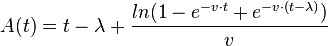 ,
,  is the logarithm of the initial number of cells (inoculum),
  is the maximal growth rate,
  is the curvature parameter (=1 for logistic growth),
  is the lag phase and
  is the rate limiting growth (usually assumed to be equal to ). The specific growth rate () is the first derivative of this equation and describes the change in the growth rate according to the cell population status.
The parameters for the cellular growth were derived from the experimental data for Streptomyces growth reported by Nieselt et al. [8] by performing a nonlinear least squares curve-fitting. By fitting the six-parameter Baranyi–Roberts equation for bacterial growth to the number of cells (approximately calculated from the reported biomass values), the carrying capacity, the initial cell number and the maximum growth rate were estimated. As there were only 11 available experimental data points, a number of different parameter sets that all fitted the Baranyi–Roberts equation were identified, thus defining a confidence interval around the fitted data.
is the rate limiting growth (usually assumed to be equal to ). The specific growth rate () is the first derivative of this equation and describes the change in the growth rate according to the cell population status.
The parameters for the cellular growth were derived from the experimental data for Streptomyces growth reported by Nieselt et al. [8] by performing a nonlinear least squares curve-fitting. By fitting the six-parameter Baranyi–Roberts equation for bacterial growth to the number of cells (approximately calculated from the reported biomass values), the carrying capacity, the initial cell number and the maximum growth rate were estimated. As there were only 11 available experimental data points, a number of different parameter sets that all fitted the Baranyi–Roberts equation were identified, thus defining a confidence interval around the fitted data.

The prediction of the carrying capacity by the logistic equation was  cells, which is very close to the
  cells calculated from the final biomass. The parameter values for cellular growth are summarised in the table below.
| Parameter | Description | Range of values | Units |
|---|---|---|---|

|
Carrying capacity |
|
cells |

|
Initial number of cells | 
|
cells |
|
|
Maximum growth rate | 
|

|
|
|
Curvature of the growth curve during the transition from lag to the exponential phase | 
|
|
|
|
Curvature of the growth curve during the transition from exponential to the stationary phase | 
|
n.a. |
|
|
Lag phase | 
|
|
References
- ↑ 1.0 1.1 Baranyi, J. and T. A. Roberts A dynamic approach to predicting bacterial growth in food. International Journal of Food Microbiology 23(3): 277-294, 1994.
- ↑ 2.0 2.1 J. Baranyi, T. A. Roberts, P. McClure A non-autonomous differential equation to model bacterial growth. Food Microbiology 10(1): 43-59, 1993.
- ↑ 3.0 3.1 3.2 S. Mehra, S. Charaniya, E. Takano, and W.-S. Hu. A bistable gene switch for antibiotic biosynthesis: The butyrolactone regulon in streptomyces coelicolor. PLoS ONE, 3(7), 2008.
- ↑ 4.0 4.1 4.2 A. Chatterjee, L. Drews, S. Mehra, E. Takano, Y.N. Kaznessis, and W.-S. Hu. Convergent transcription in the butyrolactone regulon in streptomyces coelicolor confers a bistable genetic switch for antibiotic biosynthesis. PLoS ONE, 6(7), 2011.
- ↑ 5.0 5.1 Flowers TH, Williams ST. Measurement of growth rates of streptomycetes: comparison of turbidimetric and gravimetric techniques. J Gen Microbiol. 1977;98(1):285-9.
- ↑ 6.0 6.1 Cox RA. Quantitative relationships for specific growth rates and macromolecular compositions of Mycobacterium tuberculosis, Streptomyces coelicolor A3(2) and Escherichia coli B/r: an integrative theoretical approach. Microbiology. 2004 May;150(Pt 5):1413-26.
- ↑ 7.0 7.1 Melzoch K., Teixeira de Mattos M.J., Neijssel O.M. Production of actinorhodin by Streptomyces coelicolor A3(2) grown in chemostat culture. Biotechnology and Bioengineering 1997;54(6): p. 577–582
- ↑ Nieselt, K., F. Battke, et al. The dynamic architecture of the metabolic switch in Streptomyces coelicolor. BMC Genomics 11(1): 10,2010.