Transformation of PGH2 to PGD2
The isomerisation of PGH2 to PGD2 is performed by PGDS to yield a hydroxyl group at C9 and a ketone group at C11. Two isoforms of PGDS have been found in humans, the lipocalin isoform L-PGDS which does not require glutathione for catalysis and H-PGDS, the hemopoietic type which does require glutathione. L-PGDSG is typically found in the brain, heart and testis, whereas H-PGDS is primarily found in the cytoplasm (Zhou2010 ref 6 and 7).
Upon binding to the D prostanoid (DP) receptor, the prostanoid stimulates keratinocyte cells to produce peptides which target invading pathogens (Homey, Steinhoff et al. 2006). However this species is primarily produced by LCs, mast cells and melanocytes in the cutaneous compartment (Ujihara, Horiguchi et al. 1988, Shimura, Satoh et al. 2010), and as a consequence it is unlikely to be observed in the early experimental procedures of this project.
Contents
Reaction
Chemical equation

Rate equation
Enzyme Parameters
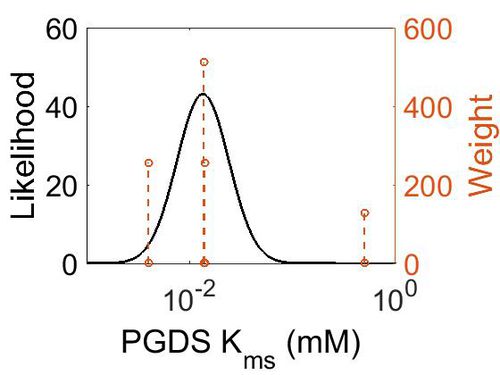
Kms
| Value | Units | Species | Notes | Reference |
|---|---|---|---|---|
| 0.0138 | 
|
Human | Expression Vector: Human Cell
Enzyme: PGDS pH: 8 Temperature: 25 |
[1] |
| 4.00E-03 | 
|
Human | Expression Vector: Cerebrospinal Fluid
Enzyme: PGDS pH:10 Temperature: Unspecified |
[2] |
| 0.50 | 
|
Human | Expression Vector: E. Coli.
Enzyme: PGDS pH:6.5 Temperature: Unspecified |
[3] |
| 1.40E-02 | 
|
Rat | Expression Vector: Cerebrospinal Fluid
Enzyme: PGDS pH:7 Temperature: 25 |
[4] |
| Mode (mM) | Confidence Interval | Location parameter (µ) | Scale parameter (σ) |
|---|---|---|---|
| 1.35E-02 | 3.78E+00 | -3.44E+00 | 9.29E-01 |
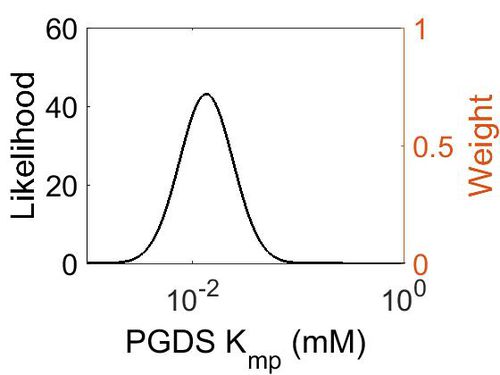
Kmp
| Mode (mM) | Location parameter (µ) | Scale parameter (σ) |
|---|---|---|
| 1.30E-02 | -4.02E+00 | 5.69E-01 |
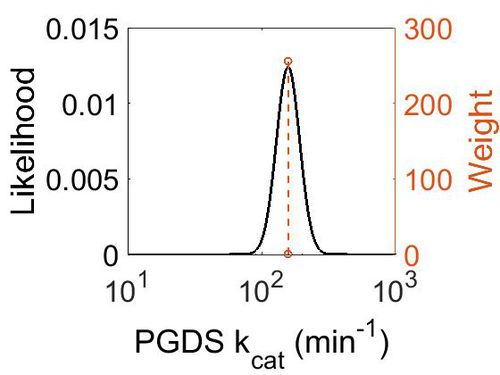
kcat
| Value | Units | Species | Notes | Reference |
|---|---|---|---|---|
| 158.4 | per minute | Human | Expression Vector: Human Cell
Enzyme: PGDS pH: 8 Temperature: 25 |
[1] |
| 1302 | per minute | Human | Expression Vector: E. Coli.
Enzyme: PGDS pH:6.5 Temperature: Unspecified |
[3] |
| Mode (min-1) | Confidence Interval | Location parameter (µ) | Scale parameter (σ) |
|---|---|---|---|
| 1.58E+02 | 1.50E+00 | 5.10E+00 | 2.00E-01 |
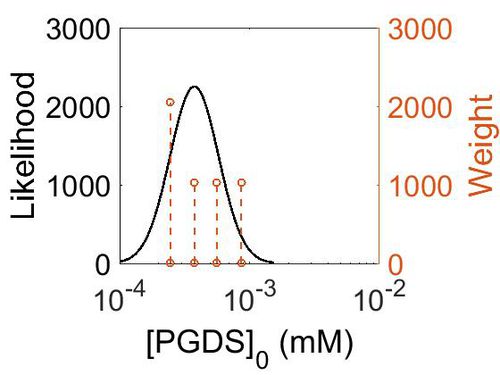
Enzyme concentrations
| Value | Units | Species | Notes | Reference |
|---|---|---|---|---|
| 156 | 
|
Human | Expression Vector: Pancreas
Enzyme: PGDS pH: 7.5 Temperature: 37 °C |
[5] |
| 101 | 
|
Human | Expression Vector: Oral Cavity
Enzyme: PGDS pH: 7.5 Temperature: 37 °C |
[6] |
| 67.9 | 
|
Human | Expression Vector: Esophagus
Enzyme: PGDS pH: 7.5 Temperature: 37 °C |
[5] |
| 44.5 | 
|
Human | Expression Vector:Skin
Enzyme: PGDS pH: 7.5 Temperature: 37 °C |
[6] |
| Mode (mM) | Confidence Interval | Location parameter (µ) | Scale parameter (σ) |
|---|---|---|---|
| 6.76E+01 | 1.64E+00 | 4.41E+00 | 4.49E-01 |
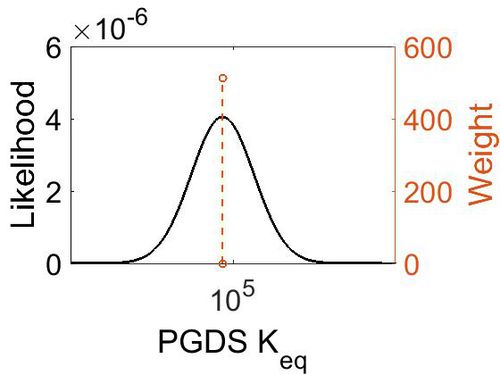
Keq
| Gibbs Free Energy Change | Units | Species | Notes | Reference |
|---|---|---|---|---|
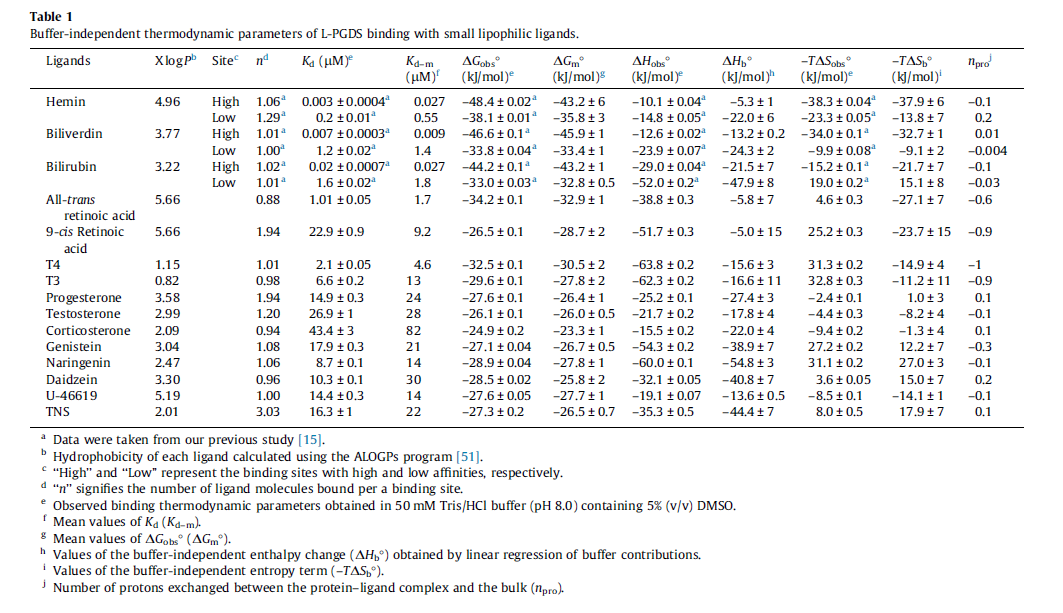
|

|
Human | Expression Vector: E. Coli
Enzyme: L-PGDS pH: 8 Temperature: 25 |
[7] |
| 5.72 | kcal/mol | Not stated | Estimated
Enzyme: PGDS Substrate: Arachidonate Product: PGD2 pH: 7.3 ionic strength: 0.25 |
[8] |
| Mode | Confidence Interval | Location parameter (µ) | Scale parameter (σ) |
|---|---|---|---|
| 7.46E+04 | 1.00E+01 | 1.20E+01 | 8.90E-01 |
References
- ↑ 1.0 1.1 [http://www.ncbi.nlm.nih.gov/pubmed/20667974 Zhou Y. , "Structure-function analysis of human l-prostaglandin D synthase bound with fatty acid molecules. FASEB J. 2010 Dec;24(12):4668-77. doi: 10.1096/fj.10-164863. Epub 2010 Jul 28.
] Cite error: Invalid
<ref>tag; name "Zhou2010" defined multiple times with different content - ↑ [http://www.ncbi.nlm.nih.gov/pubmed/8093029 Watanabe K. , "Identification of beta-trace as prostaglandin D synthase. Biochem Biophys Res Commun. 1994 Sep 15;203(2):1110-6. ]
- ↑ 3.0 3.1 [https://www.ncbi.nlm.nih.gov/pubmed/10871602 Pinzar E , "Structural basis of hematopoietic prostaglandin D synthase activity elucidated by site-directed mutagenesis. J Biol Chem. 2000 Oct 6;275(40):31239-44. ]
- ↑ [https://www.ncbi.nlm.nih.gov/pubmed/3930495 Urade Y. , "Purification and characterization of rat brain prostaglandin D synthetase. J Biol Chem. 1985 Oct 15;260(23):12410-5.]
- ↑ 5.0 5.1 M. Kim A draft map of the human proteome Nature, 2014 509, 575–581
- ↑ 6.0 6.1 M. Wilhelm Mass-spectrometry-based draft of the human proteome Nature, 2014 509, 582–587
- ↑ [http://ac.els-cdn.com/S0014579314000982/1-s2.0-S0014579314000982-main.pdf?_tid=7f323a24-6543-11e6-82ac-00000aab0f01&acdnat=1471525305_289e200c1e492c5fa693179a5396fd82 Kume S., "Fine-tuned broad binding capability of human lipocalin-type prostaglandin D synthase for various small lipophilic ligands FEBS Letters Volume 588, Issue 6, 18 March 2014, Pages 962–969]
- ↑ Caspi et al 2014, "The MetaCyc database of metabolic pathways and enzymes and the BioCyc collection of Pathway/Genome Databases," Nucleic Acids Research 42:D459-D471


