Difference between revisions of "Transformation of AA to exAA"
(Created page with " Return to overview Return to ATP-Binding Cassette Transporters == Rate ...") |
(→Transport Parameters) |
||
| Line 8: | Line 8: | ||
== Transport Parameters == | == Transport Parameters == | ||
| − | + | ===K<sub>ms</sub>=== | |
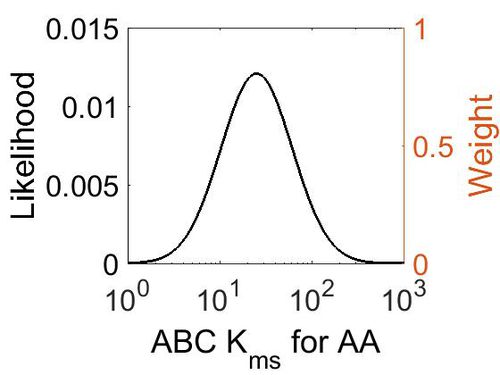
| + | In this model numerous simplifications have been made and as a result, metabolites, such as AA, occur in higher concentrations than are found in reality. To prevent a large percentage of AA being exported before it is metabolised, the Km of the ABC transporter has been increased (mode= 25 mM, CIF=10, µ = 4.01, σ = 0.89). | ||
{|class="wikitable sortable" | {|class="wikitable sortable" | ||
| − | |+ style="text-align: left;" | | + | |+ style="text-align: left;" | Literature values |
|- | |- | ||
! Value | ! Value | ||
| Line 59: | Line 60: | ||
|- | |- | ||
|} | |} | ||
| + | {| class="wikitable" | ||
| + | |+ style="text-align: left;" | Description of the ABC kcat distribution | ||
| + | ! Mode (mM) !! Confidence Interval !! Location parameter (µ) !! Scale parameter (σ) | ||
| + | |- | ||
| + | | 1.13E+01 || 1.00E+01 || 3.22E+00 || 8.91E-01 | ||
| + | |} | ||
| + | |||
| + | |||
| + | [[Image:129_-_v2.jpg|none|thumb|500px|The estimated probability distribution for ABC Kms. The value and weight of the literature values used to define the distribution are indicated by an orange dashed line. The x axis is plotted on a log-scale. ]] | ||
| + | === k<sub>cat</sub>=== | ||
No data available on the turnover of ABCC4 transporter therefore based upon estimates made by http://book.bionumbers.org/what-are-the-rates-of-membrane-transporters/ | No data available on the turnover of ABCC4 transporter therefore based upon estimates made by http://book.bionumbers.org/what-are-the-rates-of-membrane-transporters/ | ||
{|class="wikitable sortable" | {|class="wikitable sortable" | ||
| − | |+ style="text-align: left;" | | + | |+ style="text-align: left;" | Literature values |
|- | |- | ||
! Value | ! Value | ||
| Line 91: | Line 102: | ||
Back of the envelope calculation http://bionumbers.hms.harvard.edu/bionumber.aspx?&id=101737 | Back of the envelope calculation http://bionumbers.hms.harvard.edu/bionumber.aspx?&id=101737 | ||
|<ref name="Ye2001"> [https://www.ncbi.nlm.nih.gov/pubmed/11561293?dopt=Abstract Ye L. ''Expression and activity of the Hxt7 high-affinity hexose transporter of Saccharomyces cerevisiae''Yeast. 2001 Sep 30;18(13):1257-67.]</ref> | |<ref name="Ye2001"> [https://www.ncbi.nlm.nih.gov/pubmed/11561293?dopt=Abstract Ye L. ''Expression and activity of the Hxt7 high-affinity hexose transporter of Saccharomyces cerevisiae''Yeast. 2001 Sep 30;18(13):1257-67.]</ref> | ||
| + | |- | ||
| + | |11.34 | ||
| + | |min-1 | ||
| + | |Human | ||
| + | |pH 7.0, 37°C, recombinant MRP2, | ||
| + | Substrate: Estrone glucuronide | ||
| + | |<ref name="Yas2007"> [http://ac.els-cdn.com/S0928098708003618/1-s2.0-S0928098708003618-main.pdf?_tid=a147bd90-1dc8-11e6-9405-00000aab0f26&acdnat=1463666001_5a08a971497da36ce8a604f84caadfc2 Yasunaga M. "Molecular cloning and functional characterization of cynomolgus monkey multidrug resistance-associated protein 2 (MRP2)'' Eur. J. Pharm. Sci. 35, 326-334 (2008)]</ref> | ||
|- | |- | ||
|} | |} | ||
| + | {| class="wikitable" | ||
| + | |+ style="text-align: left;" | Description of the ABC Kms distribution | ||
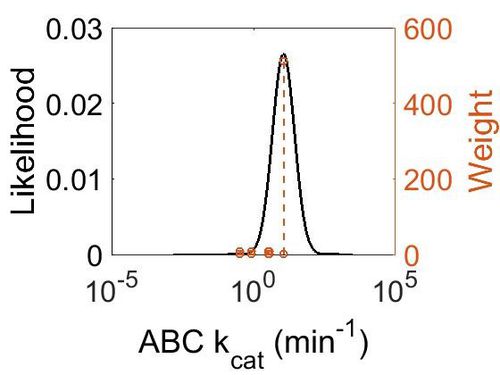
| + | ! Mode (min-1) !! Confidence Interval !! Location parameter (µ) !! Scale parameter (σ) | ||
| + | |- | ||
| + | | 2.10E-02 || 2.37E+01 || -2.60E+00 || 1.12E+00 | ||
| + | |} | ||
| + | |||
| + | [[Image:abc kcat.jpg|none|thumb|500px|The estimated probability distribution for ABC kcat. The value and weight of the literature values used to define the distribution are indicated by an orange dashed line. The x axis is plotted on a log-scale. ]] | ||
| + | |||
| + | ===V<sub>max</sub>=== | ||
{|class="wikitable sortable" | {|class="wikitable sortable" | ||
| − | |+ style="text-align: left;" | | + | |+ style="text-align: left;" | Literature values |
|- | |- | ||
! Value | ! Value | ||
| Line 125: | Line 153: | ||
|} | |} | ||
| − | + | === Transporter concentration === | |
{|class="wikitable sortable" | {|class="wikitable sortable" | ||
| − | |+ style="text-align: left;" | | + | |+ style="text-align: left;" | Literature values |
|- | |- | ||
! Value | ! Value | ||
| Line 163: | Line 191: | ||
|- | |- | ||
|} | |} | ||
| + | |||
| + | {| class="wikitable" | ||
| + | |+ style="text-align: left;" | Description of the ABC concentration distribution | ||
| + | ! Mode (mM) !! Confidence Interval !! Location parameter (µ) !! Scale parameter (σ) | ||
| + | |- | ||
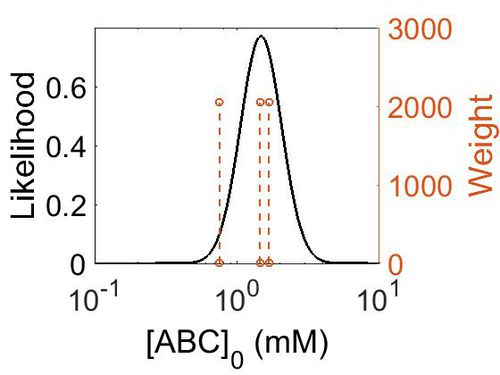
| + | | 5.06E+00 || 1.44E+00 || 1.74E+00 || 3.42E-01 | ||
| + | |} | ||
| + | |||
| + | [[Image:153.jpg|none|thumb|500px|The estimated probability distribution for ABC concentration. The value and weight of the literature values used to define the distribution are indicated by an orange dashed line. The x axis is plotted on a log-scale. ]] | ||
== References == | == References == | ||
<references/> | <references/> | ||
Revision as of 09:27, 16 May 2019
Return to ATP-Binding Cassette Transporters
Contents
Rate equation
Transport Parameters
Kms
In this model numerous simplifications have been made and as a result, metabolites, such as AA, occur in higher concentrations than are found in reality. To prevent a large percentage of AA being exported before it is metabolised, the Km of the ABC transporter has been increased (mode= 25 mM, CIF=10, µ = 4.01, σ = 0.89).
| Value | Units | Species | Notes | Reference |
|---|---|---|---|---|
| 0.0109 ± 0.0041 | mM | Human | Substrate: LTC4
pH 7.0, 37°C, recombinant MRP2, using 4mM MgATP and 5g of isolated membranes. |
[1] |
| 0.0000366 ± 0.0000038 | mM | Human | Substrate LTC4, 37 °C, 4 mM ATP, | [2] |
| 5.3E-3 ± 2.6E-3 | mM | Human | 4 mM ATP, 37°C, 5–10 ml of membrane vesicle suspension (30
mg protein). |
[3] |
| 0.1954 ± 0.0612 | mM | Human | pH 7.0, 37°C, recombinant MRP2,
Substrate: 17beta-estradiol 17-(beta-D-glucuronide) |
[1] |
| 0.1097 ± 0.0391 | mM | Human | pH 7.0, 37°C, recombinant MRP2,
Substrate: Estrone glucuronide |
[1] |
| 0.0207 | mM | Human | pH 7.4, 37°C, Substrate: Progesterone, Expression vector: Human HepG2 hepatoma | [4] |
| Mode (mM) | Confidence Interval | Location parameter (µ) | Scale parameter (σ) |
|---|---|---|---|
| 1.13E+01 | 1.00E+01 | 3.22E+00 | 8.91E-01 |
kcat
No data available on the turnover of ABCC4 transporter therefore based upon estimates made by http://book.bionumbers.org/what-are-the-rates-of-membrane-transporters/
| Value | Units | Transporter | Notes | Reference |
|---|---|---|---|---|
| 3.5 | min-1 | Glucose transporter ptsI | Organism: Bacteria Escherichia coli
Back of the envelope calculation by BioNumbers: http://bionumbers.hms.harvard.edu/bionumber.aspx?&id=102931 |
[5] |
| 0.33 - 0.83 | min-1 | Rate of transport of H+/Lactose transporter | Organism: Bacteria Escherichia coli
Back of the envelop calculation on bionumbers http://bionumbers.hms.harvard.edu/bionumber.aspx?&id=103159 |
[6] |
| 3.28 | min-1 | Catalytic Rate of transporter HXT7 | Organism: Budding yeast Saccharomyces cerevisiae
Back of the envelope calculation http://bionumbers.hms.harvard.edu/bionumber.aspx?&id=101737 |
[7] |
| 11.34 | min-1 | Human | pH 7.0, 37°C, recombinant MRP2,
Substrate: Estrone glucuronide |
[1] |
| Mode (min-1) | Confidence Interval | Location parameter (µ) | Scale parameter (σ) |
|---|---|---|---|
| 2.10E-02 | 2.37E+01 | -2.60E+00 | 1.12E+00 |
Vmax
| Value | Units | Species | Notes | Reference |
|---|---|---|---|---|
| 0.00019 ± 1.96e-5 | mmol/min/mg protein | Human | Substrate: LTC4
pH 7.0, 37°C, recombinant MRP2, using 4mM MgATP and 5g of isolated membranes. |
[1] |
| 1.25e-7 ± 1.2e-8 | mmol/min/mg | Human | Substrate LTC4, 37 °C, 4 mM ATP, | [2] |
| 2.02e-8 ± 5.9e-9 | mmol/mg/min | Human | 4 mM ATP, 37°C, 5–10 ml of membrane vesicle suspension (30
mg protein). |
[3] |
Transporter concentration
| Value | Units | Species | Notes | Reference |
|---|---|---|---|---|
| 5.15 | ppm | Human | Expression Vector: Stomach
Enzyme: ABCC4 pH: 7.5 Temperature: 37 °C |
[8] |
| 5.94 | ppm | Human | Expression Vector: Lung
Enzyme: ABCC4 pH: 7.5 Temperature: 37 °C |
[9] |
| 2.66 | ppm | Human | Expression Vector: Gut
Enzyme: ABCC4 pH: 7.5 Temperature: 37 °C |
[9] |
| Mode (mM) | Confidence Interval | Location parameter (µ) | Scale parameter (σ) |
|---|---|---|---|
| 5.06E+00 | 1.44E+00 | 1.74E+00 | 3.42E-01 |
References
- ↑ 1.0 1.1 1.2 1.3 1.4 Yasunaga M. "Molecular cloning and functional characterization of cynomolgus monkey multidrug resistance-associated protein 2 (MRP2) Eur. J. Pharm. Sci. 35, 326-334 (2008)
- ↑ 2.0 2.1 Zeng H. "Transport of amphipathic anions by human multidrug resistance protein 3 J. Biol. Chem. 275, 34166-34172 (2000) Cite error: Invalid
<ref>tag; name "Mao2000" defined multiple times with different content - ↑ 3.0 3.1 "Functional reconstitution of substrate transport by purified multidrug resistance protein MRP1 (ABCC1) in phospholipid vesicles Cancer Res. 60, 4779-4784 (2000)
- ↑ W. Fong "Schisandrol A from Schisandra chinensis Reverses P-Glycoprotein-Mediated Multidrug Resistance by Affecting Pgp-Substrate Complexes Planta Med 2007; 73(3): 212-220
- ↑ Waygood EB Enzyme I of the phosphoenolpyruvate: sugar phosphotransferase system of Escherichia coli. Purification to homogeneity and some properties.Can J Biochem. 1980 Jan;58(1):40-8.
- ↑ Naftalin R. J. ELactose permease H+-lactose symporter: mechanical switch or Brownian ratchet?Biophys J. 2007 May 15;92(10):3474-91. Epub 2007 Feb 26.
- ↑ Ye L. Expression and activity of the Hxt7 high-affinity hexose transporter of Saccharomyces cerevisiaeYeast. 2001 Sep 30;18(13):1257-67.
- ↑ M. Wilhelm Mass-spectrometry-based draft of the human proteome Nature, 2014 509, 582–587
- ↑ 9.0 9.1 M. Kim A draft map of the human proteome Nature, 2014 509, 575–581


