Degradation of a
The mRNA of scbA (a) degrades.
Contents
Chemical equation

Rate equation
![r= d_{mA}\cdot[a]](/wiki/images/math/0/4/2/042132ce3d5738225741e4a6877398ed.png)
Parameters
The parameter of this reaction is the degradation rate of a ( ). The parameter values were derived from calculations of the mRNA half life in gram positive bacteria with low GC content and in Actinomycetes.
| Name | Value | Units | Value in previous GBL models [1] [2] | Remarks-Reference |
|---|---|---|---|---|

|
 [3] [4] [3] [4]
|

|
 [1] [1]
Range tested: ( Bistability range: ( and ( |
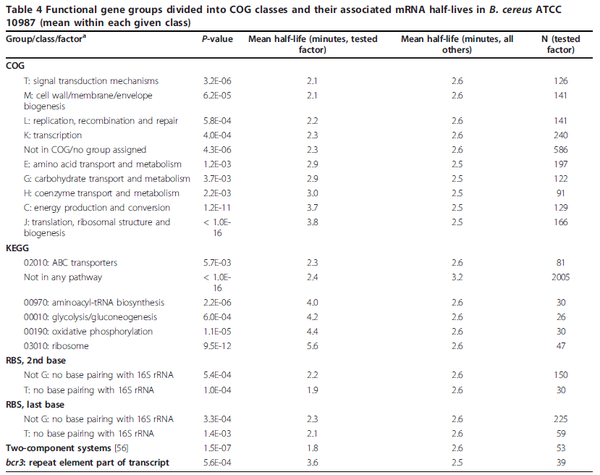
In a study on global analysis of mRNA decay in gram positive bacteria by RNA-Seq, Kristoffersen et al. reported a range of values for the half-life ( ) of mRNA in B. cereus between ) of mRNA in B. cereus between  , with a median of , with a median of  . From these values we calculated the mRNA degradation rate of scbA as per . From these values we calculated the mRNA degradation rate of scbA as per  , which resulted in a degradation rate constant value range , which resulted in a degradation rate constant value range  and a median and a median  . .
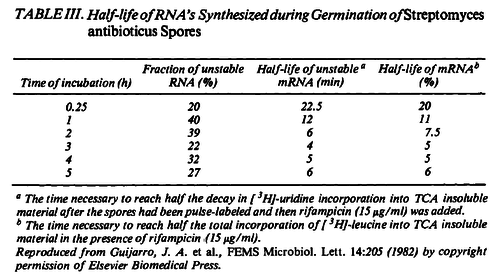
 Kristoffersen et al. 2012[3] Additionally, in a book on biological and biochemical aspects of Actinomycetes, Ortiz-Ortiz et al. reported a range of mRNA degradation rates for Streptomyces antibioticus spores between  Ortiz-Ortiz et al. 1984[4] |
Parameters with uncertainty
When deciding how to describe the uncertainty for this parameter we must take into consideration that the reported values are either calculated or derived with approximation from experiments. Additionally they correspond to mRNA degradation rates of different bacteria species (B. cereus) and to unstable mRNA in S. antibioticus spores. This means that there might be a notable difference between the actual parameter values and the ones reported in literature. These facts influence the quantification of the parameter uncertainty and therefore the shape of the corresponding distribution. By assigning the appropriate weights to the parameter values and using the method described here, the appropriate probability distributions were designed.
Therefore, although the weight of the distribution is put on the values calculated for the Streptomyces species by setting the mode of the log-normal distribution of the  to
to  , we wish to explore the full range of reported values and maybe even sample a small percentage of values outside the reported range. Thus, the Spread was set to
  , which means that the range where 68.27% of the values are found is between
  and
and  .
.
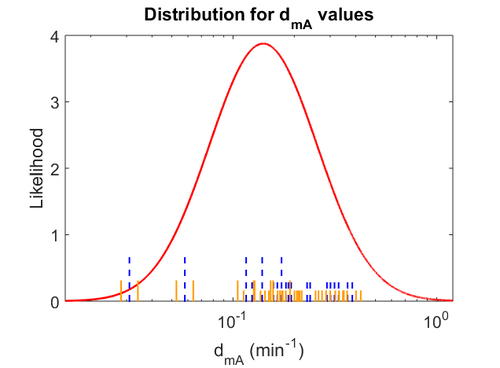
The probability distribution for the parameter, adjusted accordingly in order to reflect the above values, is the following:
The values retrieved from literature and their weights are indicated by the blue dashed lines, and the uncertainty for each value is indicated using a default value of 10% error (orange lines).
The parameter information of the distribution is:
| Parameter | Mode | Spread | μ | σ |
|---|---|---|---|---|

|

|

|

|

|
References
- ↑ 1.0 1.1 1.2 S. Mehra, S. Charaniya, E. Takano, and W.-S. Hu. A bistable gene switch for antibiotic biosynthesis: The butyrolactone regulon in streptomyces coelicolor. PLoS ONE, 3(7), 2008.
- ↑ 2.0 2.1 2.2 A. Chatterjee, L. Drews, S. Mehra, E. Takano, Y.N. Kaznessis, and W.-S. Hu. Convergent transcription in the butyrolactone regulon in streptomyces coelicolor confers a bistable genetic switch for antibiotic biosynthesis. PLoS ONE, 6(7), 2011.
- ↑ 3.0 3.1 Kristoffersen SM, Haase C, Weil MR, et al. Global mRNA decay analysis at single nucleotide resolution reveals segmental and positional degradation patterns in a Gram-positive bacterium. Genome Biology. 2012;13(4):R30.
- ↑ 4.0 4.1 Ortiz-Ortiz, L. and Bojalil, L.F. and Yakoleff, V. Biological, Biochemical, and Biomedical Aspects of Actinomycetes. Elsevier, 1984


 )
)

 )
)

 )
)
 . By the same calculations, the corresponding mRNA degradation rate constants are in the range
  .
.
