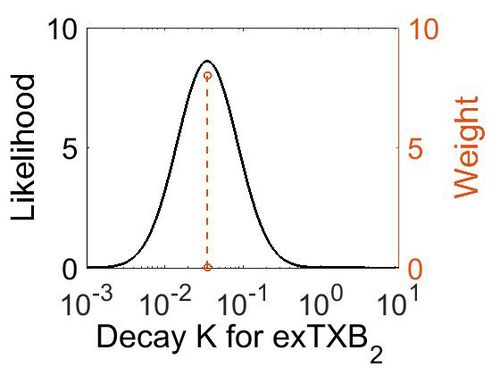
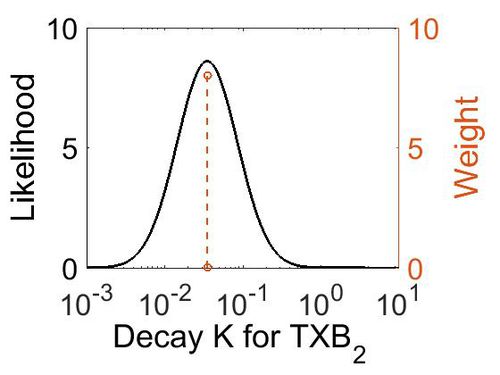
Decay of TXB2/exTXB2
Return to Degradation Pathways
Rate equation
Decay Parameters
| Reaction # | Species | Half Life (min) | Rate constant(min -1) | Notes | Weight | Reference |
|---|---|---|---|---|---|---|
| 45 | exTXB2 | 20 to 30 | 0.035 to 0.023 | Quoted in a textbook(https://books.google.co.uk/books?id=_9kEeTjyJdMC&pg=PA864&lpg=PA864&dq=half+life+txa2&source=bl&ots=2OTF4Mh2Jk&sig=hu79GprliUcW4QE_Zm79islesOA&hl=en&sa=X&ved=0ahUKEwj0oo2sgfjOAhXLIcAKHcaPDHQQ6AEIRjAI#v=onepage&q=half%20life%20txa2&f=false) with no ref. | 8 |
| Mode (min-1) | Confidence Interval | Location parameter (µ) | Scale parameter (σ) |
|---|---|---|---|
| 3.48E-02 | 1.10E+00 | -3.35E+00 | 9.49E-02 |


