Return to overview
Return to Degradation Pathways
Rate equation
Decay Parameters
Literature values
| Reaction #
|
Species
|
Half Life (min)
|
Rate constant(min -1)
|
Notes
|
Weight
|
Reference
|
| 44
|
exPGF2a
|
900 ± 492
|
0.001 ± 0.001
|
Study performed in decidual stromal cells and macrophages in culture.
|
8
|
[1]
|
Description of the PGF2a decay constant distribution
| Mode (min-1) |
Confidence Interval |
Location parameter (µ) |
Scale parameter (σ)
|
| 7.07E-04 |
2.30E+00 |
-6.80E+00 |
6.76E-01
|
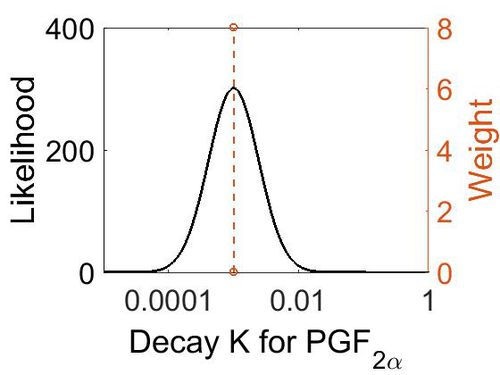
The estimated probability distribution for PGF2a decay constant. The value and weight of the literature values used to define the distribution are indicated by an orange dashed line. The x axis is plotted on a log-scale.
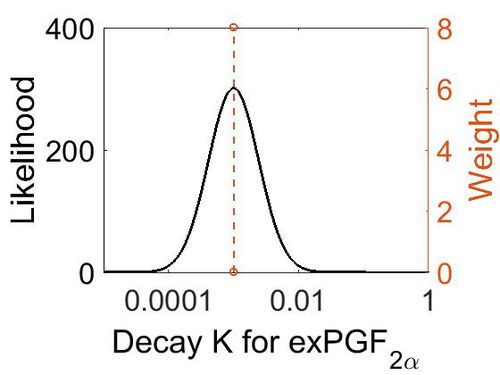
The estimated probability distribution for exPGF2a decay constant. The value and weight of the literature values used to define the distribution are indicated by an orange dashed line. The x axis is plotted on a log-scale.
References


