46BR.1N fibroblasts Proteomic Analysis Results
Preliminary analysis of the proteomic dataset
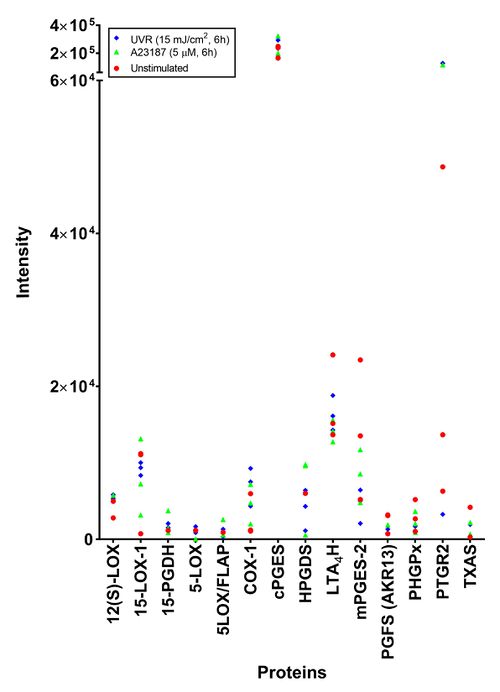
The aim of this study was to investigate the proteins related to the AA cascade using SWATH-MS. As this was a preliminary study, the results are presented as raw intensities.
To investigate the effect of treatment on protein expression, cells stimulated with A23187 (5 µM, 6h), UVR (15 mJ/cm2, 24h) and unstimulated cells were analysed. Peptides were detected for all proteins responsible for the production of lipid mediators detected by LC-MS/MS. No peptides were detected for the UVR inducible proteins (COX-2 and mPGES-1) in the irradiated samples. The protein that was detected at the highest mean intensity and the most consistently was PTGR-2, the prostaglandin reductase protein. The most inconsistent protein was PGFS (AKR13), the aldo-keto reductase family 1-member C3 isoform of prostaglandin F synthase. When the different treatments were compared, no difference could be found.
| Unstimulated | A23187 (5 mM, 6h) | UVR (15 mJ/cm2, 6h) | |||||||
|---|---|---|---|---|---|---|---|---|---|
| Mean | SD | n | Mean | SD | n | Mean | SD | n | |
| 12(S)-LOX | 3.89E+03 | 1.92E+03 | 4 | 5.77E+03 | 0.00E+00 | 1 | 5.65E+03 | 1.46E+03 | 3 |
| 15-LOX-1 | 8.52E+03 | 5.21E+03 | 4 | 9.18E+03 | 5.18E+03 | 4 | 9.44E+03 | 1.15E+03 | 4 |
| 15-PGDH | 1.16E+03 | 6.06E+02 | 2 | 1.75E+03 | 1.40E+03 | 4 | 1.79E+03 | 3.80E+02 | 2 |
| 5-LOX | 1.17E+03 | 0.00E+00 | 1 | 5.30E+01 | 0.00E+00 | 1 | 1.36E+03 | 1.17E+03 | 4 |
| 5LOX/FLAP | 9.06E+02 | 0.00E+00 | 1 | 1.93E+03 | 1.18E+03 | 3 | 8.32E+02 | 6.92E+02 | 2 |
| COX-1 | 2.36E+03 | 2.40E+03 | 4 | 4.66E+03 | 2.58E+03 | 3 | 6.36E+03 | 2.86E+03 | 4 |
| cPGES | 2.13E+05 | 8.09E+04 | 5 | 2.31E+05 | 1.42E+05 | 6 | 2.30E+05 | 9.48E+04 | 6 |
| HPGDS | 6.01E+03 | 0.00E+00 | 1 | 6.67E+03 | 5.27E+03 | 3 | 4.04E+03 | 2.20E+03 | 4 |
| LTA4H | 1.64E+04 | 5.48E+03 | 5 | 1.42E+04 | 3.14E+03 | 6 | 1.64E+04 | 2.95E+03 | 6 |
| mPGES-2 | 1.22E+04 | 9.04E+03 | 5 | 8.36E+03 | 6.24E+03 | 6 | 4.52E+03 | 2.34E+03 | 6 |
| PGFS (AKR13) | 2.34E+03 | 1.39E+03 | 3 | 1.90E+03 | 0.00E+00 | 1 | 1.32E+03 | 0.00E+00 | 1 |
| PHGPx | 2.90E+03 | 2.18E+03 | 4 | 2.17E+03 | 1.55E+03 | 4 | 1.47E+03 | 4.73E+02 | 3 |
| PTGR2 | 2.29E+04 | 3.68E+04 | 6 | 4.49E+05 | 5.19E+05 | 5 | 2.94E+05 | 5.95E+05 | 6 |
| TXAS | 2.89E+03 | 2.41E+03 | 3 | 1.70E+03 | 1.38E+03 | 3 | 1.94E+03 | 2.02E+03 | 2 |
Further analysis of the proteomic dataset
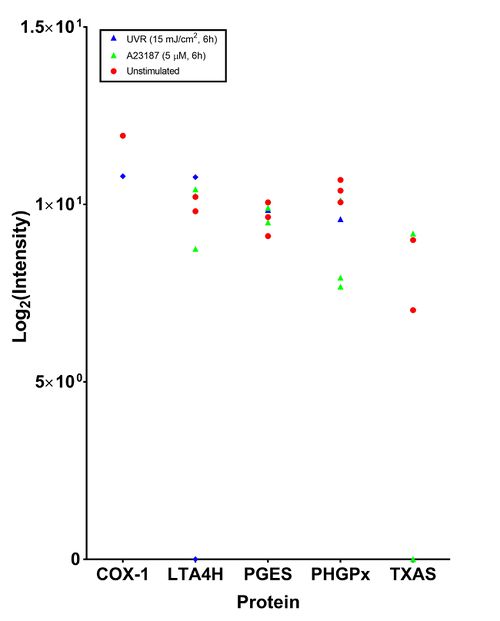
This analysis, performed by the Stoller centre, included taking the top three most intense peptide species, a 1% false discovery rate and acceptance of transition groups if it was identified in the majority of replicates (Table *, Figure *). This in-depth analysis only found five proteins related to the eicosanoid cascade. PHGPx and LTA4H were consistently identified in 7/9 samples. The isoform of PGES which was detected was not specified.
| Proteins | Unstimulated | A23187 (5 µM, 6h) | UVR (15 mJ/cm2, 24h) | ||||||
|---|---|---|---|---|---|---|---|---|---|
| Mean | SD | n | Mean | SD | n | Mean | SD | n | |
| COX-1 | 11.94 | 0 | 1 | 10.8 | 0 | 1 | |||
| LTA4H | 10.01 | 0.29 | 2 | 9.81 | 0.92 | 3 | 5.39 | 7.62 | 2 |
| PGES | 9.6 | 0.48 | 3 | 9.7 | 0.29 | 2 | 9.85 | 0 | 1 |
| PHGPx | 10.38 | 0.32 | 3 | 8.58 | 1.34 | 3 | 9.59 | 0 | 1 |
| TXAS | 8.01 | 1.4 | 2 | 3.06 | 5.3 | 3 | |||

