Return to overview
Return to 46BR.1N Fibroblasts
In this study, the aim was to identify optimal conditions for the following experiments. These assays were performed using the MTT assay.
Optimum seeding density
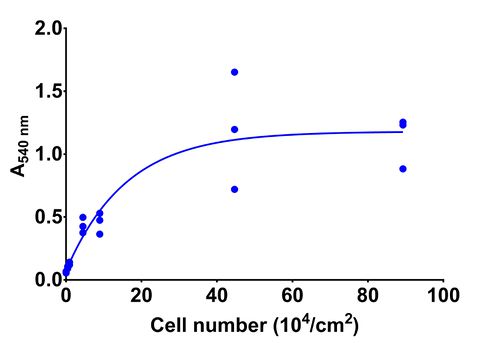
The absorbance of various seeding densities (4.4 x10^3 - 9 x10^5 cells/cm2) of 46BR.1N fibroblasts after 48h. The data presented is from three independent experiments.
The absorbance of various seeding densities (0.4-89 x104 cells/cm2) of 46BR.1N fibroblasts after 48h. The data presented is mean ± SD from three independent experiments.
| Cell number (10^4/cm2)
|
A540 nm
|
| 0
|
0.06 ± 0.01
|
| 0.44
|
0.10 ± 0.01
|
| 0.91
|
0.13 ± 0.01
|
| 4.47
|
0.43 ± 0.06
|
| 8.94
|
0.46 ± 0.08
|
| 44.66
|
1.19 ± 0.47
|
| 89.28
|
1.12 ± 0.21
|
Cell viability
Calcium Ionophore
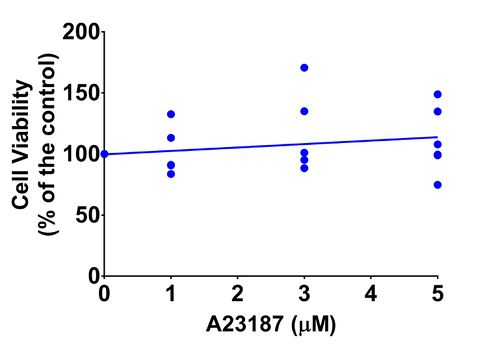
The effect of A23187 (0-5 µM) on the viability of 46BR.1N fibroblasts. Cells were incubated for 6h with the stimulus and the data presented is from six independent experiments.
The effect of A23187 (0-5 µM) on the viability of 46BR.1N fibroblasts. Cells were incubated for 6h with the stimulus and the data presented is mean ± SD from six independent experiments.
| A23187 (uM)
|
Cell Viability (% of the control)
|
| 0
|
100.00 ± 0.00
|
| 1
|
99.12 ± 19.69
|
| 3
|
114.22 ± 32.20
|
| 5
|
110.78 ± 26.82
|
ATP
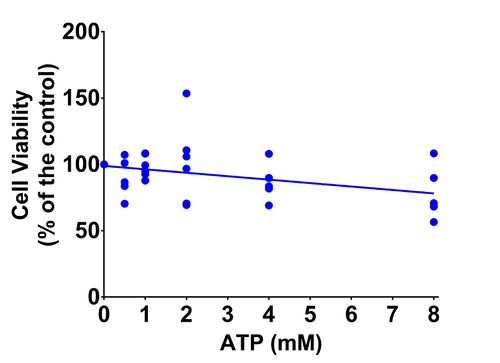
The effect of ATP (0-8 mM) on the viability of 46BR.1N fibroblasts. Cells were incubated for 6h with the stimulus and the data presented is from six independent experiments.
The effect of ATP (0-8 mM) on the viability of 46BR.1N fibroblasts. Cells were incubated for 6h with the stimulus and the data presented is mean ± SD from six independent experiments.
| ATP (mM)
|
Cell Viability (% of the control)
|
| 0
|
100.00 ± 0.00
|
| 0.5
|
89.20 ± 13.15
|
| 1
|
98.49 ± 8.38
|
| 2
|
101.10 ± 31.04
|
| 4
|
86.94 ± 12.78
|
| 8
|
77.30 ± 18.56
|
UVR
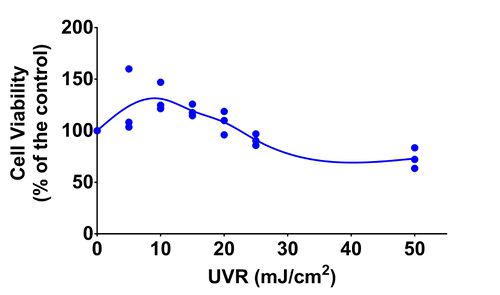
The effect of UVR (0-50 mJ/cm2) on the viability of 46BR.1N fibroblasts. Cells were incubated for 6h following stimulation and the data presented is from three independent experiments.
The effect of UVR (0-50 mJ/cm2) on the viability of 46BR.1N fibroblasts. Cells were incubated for 6h following stimulation and the data presented is mean ± SD from three independent experiments.
| UVR (mJ/cm2)
|
Cell Viability (% of the control)
|
| 0
|
100.00 ± 0.00
|
| 5
|
123.84 ± 31.35
|
| 10
|
131.00 ± 13.93
|
| 15
|
119.26 ± 5.78
|
| 20
|
108.17 ± 11.40
|
| 25
|
90.98 ± 5.59
|
| 50
|
72.98 ± 10.00
|


