Return to overview
Return to 46BR.1N Fibroblasts
The aim of this study was to investigate the levels of AA derived lipid mediators in the supernatant following stimulation of cells with A23187 (with and without COX inhibition), ATP and UVR. LC-MS/MS was used for the eicosanoid analysis and the values were normalized using cell numbers (pg/106 cells). When the mediator levels were below the limit of detection and no value could be obtained, the lowest detected value for that mediator was used in order to perform analysis.
Calcium ionophore
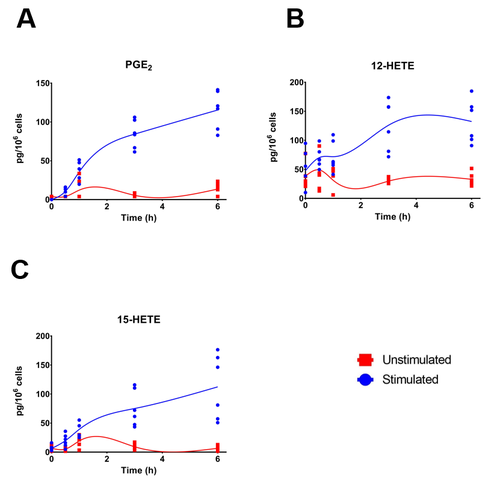
Lipid mediator levels in unstimulated (red) and stimulated with A23187 (5 µM) (blue) 46BR.1N fibroblasts over 6h. Where (A) PGE2, (B) 12-HETE and (C) 15-HETE. The data presented is from three independent experiments, each with a technical replicate.
AA-derived lipid mediators detected in the supernatant of 46BR.1N fibroblasts treated with A23187 (5 µM), for 0.5, 1, 3 and 6h. Analysis was performed using UPLC-ESI-MS/MS. Results are expressed mean ± SD (pg/106 cells) of three independent experiments.
| Time (h)
|
Mediator
|
| PGE2
|
12-HETE
|
15-HETE
|
| 0
|
0.00 ± 0.00
|
47.74 ± 34.86
|
6.25 ± 5.31
|
| 0.5
|
10.59 ± 5.40
|
70.23 ± 17.25
|
19.75 ± 11.15
|
| 1
|
35.68 ± 12.39
|
71.85 ± 26.42
|
39.19 ± 14.48
|
| 3
|
84.36 ± 18.07
|
126.00 ± 43.25
|
75.12 ± 31.18
|
| 6
|
115.42 ± 24.32
|
132.43 ± 37.50
|
112.41 ± 55.83
|
ATP
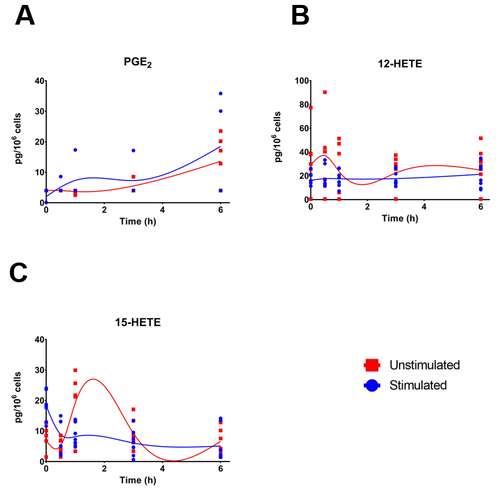
Lipid mediator levels in unstimulated (red) and stimulated with ATP (2 mM) (blue) 46BR.1N fibroblasts over 6h. Where (A) PGE2, (B) 12-HETE and (C) 15-HETE. The data presented is from three independent experiments, each with a technical replicate.
AA-derived lipid mediators detected in the supernatant of 46BR.1N fibroblasts treated with ATP (2 mM), for 0.5, 1, 3 and 6h. Analysis was performed using UPLC-ESI-MS/MS. Results are expressed mean ± SD (pg/106 cells) of three independent experiments.
| Time (h)
|
Mediator
|
| PGE2
|
12-HETE
|
15-HETE
|
| 0
|
2.05 ±
2.26
|
16.19 ± 5.01
|
18.20 ± 4.40
|
| 0.5
|
5.15 ± 2.30
|
17.64 ± 8.95
|
8.89 ± 5.65
|
| 1
|
7.33 ± 6.66
|
17.56 ± 6.75
|
8.18 ± 3.50
|
| 3
|
7.28 ± 6.56
|
17.67 ± 6.58
|
6.09 ± 4.09
|
| 6
|
18.47 ± 16.88
|
21.31 ± 10.66
|
5.10 ± 5.45
|
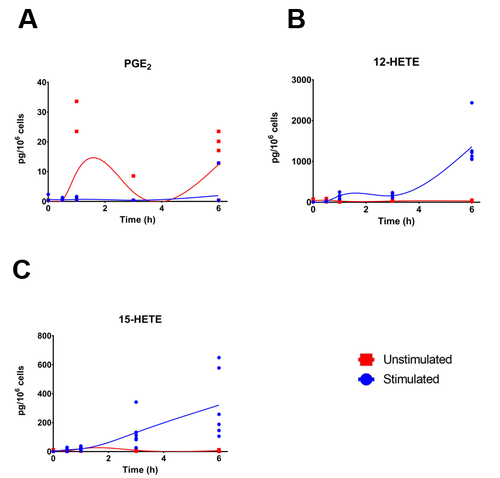
UVR
Lipid mediator levels in unstimulated (red) and stimulated with UVR (15 mJ/cm2) (blue) 46BR.1N fibroblasts over 6h. Where (A) PGE2, (B) 12-HETE and (C) 15-HETE. The data presented is from three independent experiments, each with a technical replicate.
AA-derived lipid mediators detected in the supernatant of 46BR.1N fibroblasts treated with UVR (15 mJ/cm2), for 0.5, 1, 3 and 6h. Analysis was performed using UPLC-ESI-MS/MS. Results are expressed mean ± SD (pg/106 cells) of three independent experiments.
| Time (h)
|
Mediator
|
| PGE2
|
12-HETE
|
15-HETE
|
| 0
|
1.30 ±
0.00
|
10.23 ± 7.90
|
4.72 ± 4.22
|
| 0.5
|
1.30 ± 0.00
|
47.04 ± 14.26
|
11.45 ± 9.45
|
| 1
|
1.88 ± 0.97
|
45.67 ± 22.23
|
7.09 ± 9.90
|
| 3
|
3.72 ± 3.74
|
47.25 ± 8.43
|
8.24 ± 11.25
|
| 6
|
12.70 ± 9.51
|
23.71 ± 14.78
|
8.56 ± 7.24
|
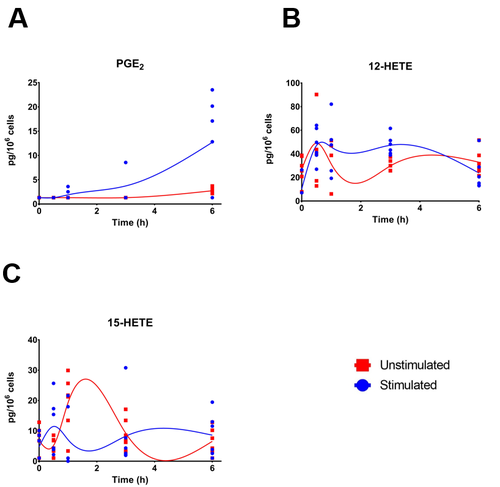
Calcium ionophore + COX inhibition
Lipid mediator levels in unstimulated (red) and stimulated with A23187 (5 µM) following COX inhibition with indomethacin (blue) 46BR.1N fibroblasts over 6h. Where (A) PGE2, (B) 12-HETE and (C) 15-HETE. The data presented is from three independent experiments, each with a technical replicate.
AA-derived lipid mediators detected in the supernatant of COX inhibited 46BR.1N fibroblasts treated with A23187 (5 µM), for 0.5, 1, 3 and 6h. Analysis was performed using UPLC-ESI-MS/MS. Results are expressed mean ± SD (pg/106 cells) of three independent experiments.
| Time (h)
|
Mediator
|
| PGE2
|
12-HETE
|
15-HETE
|
| 0
|
0.65 ±
0.70
|
3.38 ± 0.93
|
1.00 ± 0.00
|
| 0.5
|
0.57 ± 0.33
|
24.80 ± 7.35
|
11.80 ± 12.66
|
| 1
|
0.67 ± 0.51
|
157.96 ± 54.64
|
19.12 ± 11.44
|
| 3
|
0.40 ± 0.00
|
160.92 ± 55.30
|
131.63 ± 109.07
|
| 6
|
1.96 ± 4.42
|
1359.80 ± 533.74
|
320.70 ± 233.36
|


