Difference between revisions of "Translation of R"
(→Parameters) |
(→Parameters) |
||
| (25 intermediate revisions by 2 users not shown) | |||
| Line 15: | Line 15: | ||
== Parameters == | == Parameters == | ||
| − | The parameter of this reaction is the translation rate of ScbR (<math>P_{R}</math>). | + | The parameter of this reaction is the translation rate of ScbR (<math>P_{R}</math>). The parameter values were derived from calculations of the protein translation rate based on genomic properties of ''Streptomyces coelicolor'' A3(2) and ''E.coli''. |
| − | {|class="wikitable" | + | {|class="wikitable" |
! Name | ! Name | ||
! Value | ! Value | ||
! Units | ! Units | ||
| − | ! | + | ! Value in previous GBL models <ref name="Mehra2008"> [http://www.plosone.org/article/fetchObject.action?uri=info:doi/10.1371/journal.pone.0002724&representation=PDF S. Mehra, S. Charaniya, E. Takano, and W.-S. Hu. ''A bistable gene switch for antibiotic biosynthesis: The butyrolactone regulon in streptomyces coelicolor.'' PLoS ONE, 3(7), 2008.] </ref> <ref name="Chatterjee2011"> [http://www.plosone.org/article/fetchObject.action?uri=info:doi/10.1371/journal.pone.0021974&representation=PDF A. Chatterjee, L. Drews, S. Mehra, E. Takano, Y.N. Kaznessis, and W.-S. Hu. ''Convergent transcription in the butyrolactone regulon in streptomyces coelicolor confers a bistable genetic switch for antibiotic biosynthesis.'' PLoS ONE, 6(7), 2011.] </ref> |
| − | ! Remarks | + | ! Remarks-Reference |
|- | |- | ||
|<math>P_{R}</math> | |<math>P_{R}</math> | ||
| − | |<math>0. | + | |<math>0.165−5.86</math> <ref name="Cox2004"> [http://www.microbiologyresearch.org/docserver/fulltext/micro/150/5/1413.pdf?expires=1444755552&id=id&accname=guest&checksum=009138F0691A4CE7FF9CB3F361C4DC87 Cox RA. ''Quantitative relationships for specific growth rates and macromolecular compositions of Mycobacterium tuberculosis, Streptomyces coelicolor A3(2) and Escherichia coli B/r: an integrative theoretical approach.'' Microbiology. 2004 May;150(Pt 5):1413-26.] </ref> |
| − | |<math> min^{-1} </math> | + | |<math> min^{-1} </math> |
| − | | ''Streptomyces coelicolor'' A3(2) | + | |<math>0.36 s^{-1}</math> |
| − | + | ||
| − | + | <math>(21.6 min^{-1})</math><ref name="Mehra2008"></ref><ref name="Chatterjee2011"></ref> | |
| + | |||
| + | Range tested: | ||
| + | |||
| + | <math>10^{-4}-10 s^{-1}</math> | ||
| + | |||
| + | (<math>0.0001-600 min^{-1}</math>) | ||
| + | |||
| + | Bistability range: | ||
| + | |||
| + | <math>0.25-0.39 s^{-1}</math><ref name="Mehra2008"></ref> | ||
| + | |||
| + | (<math>15-23.4 min^{-1}</math>) | ||
| + | |||
| + | and <math>0.09-0.38 s^{-1}</math><ref name="Chatterjee2011"></ref> | ||
| + | |||
| + | (<math>5.4-22.8 min^{-1}</math>) | ||
| + | | In a recent publication by R.A. Cox, genomic properties and macromolecular compositions of ''Streptomyces coelicolor'' A3(2) and ''E.coli'' were reported, along with equations that connect these properties. For ''S. coelicolor'', the polypeptide elongation rate <math>ε_{aa}</math> is reported to be in the range between 0.59 and 3.17 amino acids s<sup>-1</sup>. As ScbR has 215 aa, the transcription rate constant can be calculated as per <math>P_{R}=\frac{215 aa/gene}{0.59 aa/s}=364.4 s/gene=6.07 min/gene</math> and <math>P_{R}=\frac{215 aa/gene}{3.17 aa/s}=67.82 s/gene=1.13 min/gene</math>, thus resulting in a final value of <math> 0.165 min^{-1} </math> and <math> 0.89 min^{-1} </math>. | ||
| + | <div><ul> | ||
| + | <li style="display: inline-block;"> [[Image:TR-text.png|center|thumb|700px|Cox et al. 2004<ref name="Cox2004"></ref>]] </li> | ||
| + | <li style="display: inline-block;"> [[Image:TR-text2.png|center|thumb|700px|Cox et al. 2004<ref name="Cox2004"></ref>]] </li> | ||
| + | </ul></div> | ||
| + | |||
| + | Additionally, Cox reports translation rates for ''E. coli'' between 12 and 21 aa/s. By the same calculations, the corresponding transcription rate constants are in the range <math> 3.35-5.86 min^{-1} </math>. | ||
| + | [[Image:PR-text.png|center|thumb|700px|Cox et al. 2004<ref name="Cox2004"></ref>]] | ||
|} | |} | ||
==Parameters with uncertainty== | ==Parameters with uncertainty== | ||
| − | + | When deciding how to describe the uncertainty for this parameter we must take into consideration the fact that the reported values are either calculated or derived with approximation from experiments and from other macromolecular properties. Additionally, some of the values correspond to protein translation rates of different bacteria species (''E. coli''). This means that there might be a notable difference between actual parameter values and the ones reported in literature. These facts influence the quantification of the parameter uncertainty and therefore the shape of the corresponding distribution. | |
| + | |||
| + | Therefore, although the weight of the distribution is put on the values calculated for ''S. coelicolor'' by setting <math> 0.74 min^{-1} </math> as the mode of the log-normal distribution for the <math>P_{R}</math>, we wish to explore the full range of reported values. Thus, the Spread is set to <math>3.2</math> and the range where 68.27% of the values are found is between <math>0.23</math> and <math>2.38</math> <math>min^{-1}</math>. | ||
The probability distribution for the parameter, adjusted accordingly in order to reflect the above values, is the following: | The probability distribution for the parameter, adjusted accordingly in order to reflect the above values, is the following: | ||
| − | [[Image: | + | [[Image:PRu.png|500px]] |
| + | |||
| + | The values retrieved from literature and their weights are indicated by the blue dashed lines, and the uncertainty for each value is indicated using a default value of 10% error (orange lines). | ||
| − | The | + | The parameter information of the distribution is: |
{|class="wikitable" | {|class="wikitable" | ||
! Parameter | ! Parameter | ||
| + | ! Mode | ||
| + | ! Spread | ||
! μ | ! μ | ||
! σ | ! σ | ||
|- | |- | ||
|<math>P_{R}</math> | |<math>P_{R}</math> | ||
| − | |<math>0. | + | |<math>0.744</math> |
| − | |<math>0. | + | |<math>3.2</math> |
| + | |<math>0.42952</math> | ||
| + | |<math>0.85176</math> | ||
|} | |} | ||
==References== | ==References== | ||
<references/> | <references/> | ||
Latest revision as of 15:53, 4 January 2018
The scbR mRNA (r) is translated into ScbR protein (R).


Contents
Chemical equation

Rate equation
![r= P_{R}\cdot [r]](/wiki/images/math/5/4/c/54cad205a7e9ff46454d1d24bda5d24c.png)
Parameters
The parameter of this reaction is the translation rate of ScbR ( ). The parameter values were derived from calculations of the protein translation rate based on genomic properties of Streptomyces coelicolor A3(2) and E.coli.
| Name | Value | Units | Value in previous GBL models [1] [2] | Remarks-Reference |
|---|---|---|---|---|
|
|
 [3] [3]
|

|

Range tested:
( Bistability range: ( and ( |
In a recent publication by R.A. Cox, genomic properties and macromolecular compositions of Streptomyces coelicolor A3(2) and E.coli were reported, along with equations that connect these properties. For S. coelicolor, the polypeptide elongation rate  is reported to be in the range between 0.59 and 3.17 amino acids s-1. As ScbR has 215 aa, the transcription rate constant can be calculated as per is reported to be in the range between 0.59 and 3.17 amino acids s-1. As ScbR has 215 aa, the transcription rate constant can be calculated as per 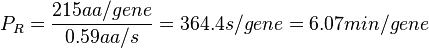 and and 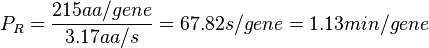 , thus resulting in a final value of , thus resulting in a final value of  and and  . .
Additionally, Cox reports translation rates for E. coli between 12 and 21 aa/s. By the same calculations, the corresponding transcription rate constants are in the range  Cox et al. 2004[3] |
 )
)
 )
)
 )
)


 .
.
Parameters with uncertainty
When deciding how to describe the uncertainty for this parameter we must take into consideration the fact that the reported values are either calculated or derived with approximation from experiments and from other macromolecular properties. Additionally, some of the values correspond to protein translation rates of different bacteria species (E. coli). This means that there might be a notable difference between actual parameter values and the ones reported in literature. These facts influence the quantification of the parameter uncertainty and therefore the shape of the corresponding distribution.
Therefore, although the weight of the distribution is put on the values calculated for S. coelicolor by setting  as the mode of the log-normal distribution for the , we wish to explore the full range of reported values. Thus, the Spread is set to
  and the range where 68.27% of the values are found is between
  and
and  .
.
The probability distribution for the parameter, adjusted accordingly in order to reflect the above values, is the following:

The values retrieved from literature and their weights are indicated by the blue dashed lines, and the uncertainty for each value is indicated using a default value of 10% error (orange lines).
The parameter information of the distribution is:
| Parameter | Mode | Spread | μ | σ |
|---|---|---|---|---|
|
|

|
|

|

|
References
- ↑ 1.0 1.1 1.2 S. Mehra, S. Charaniya, E. Takano, and W.-S. Hu. A bistable gene switch for antibiotic biosynthesis: The butyrolactone regulon in streptomyces coelicolor. PLoS ONE, 3(7), 2008.
- ↑ 2.0 2.1 2.2 A. Chatterjee, L. Drews, S. Mehra, E. Takano, Y.N. Kaznessis, and W.-S. Hu. Convergent transcription in the butyrolactone regulon in streptomyces coelicolor confers a bistable genetic switch for antibiotic biosynthesis. PLoS ONE, 6(7), 2011.
- ↑ 3.0 3.1 3.2 3.3 Cox RA. Quantitative relationships for specific growth rates and macromolecular compositions of Mycobacterium tuberculosis, Streptomyces coelicolor A3(2) and Escherichia coli B/r: an integrative theoretical approach. Microbiology. 2004 May;150(Pt 5):1413-26.