Difference between revisions of "Translation of A"
Marcbiarnesc (talk | contribs) (→Parameters) |
(→Parameters) |
||
| Line 15: | Line 15: | ||
== Parameters == | == Parameters == | ||
| − | The parameter of this reaction is the translation rate of ScbA (<math>P_{A}</math>). | + | The parameter of this reaction is the translation rate of ScbA (<math>P_{A}</math>).The parameter values were derived from calculations of the protein translation rate based on genomic properties of ''Streptomyces coelicolor'' A3(2) and ''E.coli''. |
| − | {|class="wikitable" | + | {|class="wikitable" |
! Name | ! Name | ||
! Value | ! Value | ||
! Units | ! Units | ||
| − | ! | + | ! Value in previous GBL models <ref name="Mehra2008"> [http://www.plosone.org/article/fetchObject.action?uri=info:doi/10.1371/journal.pone.0002724&representation=PDF S. Mehra, S. Charaniya, E. Takano, and W.-S. Hu. ''A bistable gene switch for antibiotic biosynthesis: The butyrolactone regulon in streptomyces coelicolor.'' PLoS ONE, 3(7), 2008.] </ref> <ref name="Chatterjee2011"> [http://www.plosone.org/article/fetchObject.action?uri=info:doi/10.1371/journal.pone.0021974&representation=PDF A. Chatterjee, L. Drews, S. Mehra, E. Takano, Y.N. Kaznessis, and W.-S. Hu. ''Convergent transcription in the butyrolactone regulon in streptomyces coelicolor confers a bistable genetic switch for antibiotic biosynthesis.'' PLoS ONE, 6(7), 2011.] </ref> |
| − | ! Remarks | + | ! Remarks-Reference |
|- | |- | ||
|<math>P_{A}</math> | |<math>P_{A}</math> | ||
| − | |<math>0. | + | |<math>0.11-4</math> <ref name="Cox2004"> [http://www.microbiologyresearch.org/docserver/fulltext/micro/150/5/1413.pdf?expires=1444755552&id=id&accname=guest&checksum=009138F0691A4CE7FF9CB3F361C4DC87 Cox RA. ''Quantitative relationships for specific growth rates and macromolecular compositions of Mycobacterium tuberculosis, Streptomyces coelicolor A3(2) and Escherichia coli B/r: an integrative theoretical approach.'' Microbiology. 2004 May;150(Pt 5):1413-26.] </ref> |
| − | |<math> min^{1} </math> | + | |<math> min^{-1} </math> |
| − | |''Streptomyces coelicolor'' A3(2) | + | |<math>0.066 s^{-1}</math><ref name="Mehra2008"></ref><ref name="Chatterjee2011"></ref> |
| − | + | ||
| − | + | (Range tested: <math>10^{-4}-10 s^{-1}</math>) | |
| + | |||
| + | (Bistability range: <math>0.064-0.072 s^{-1}</math><ref name="Mehra2008"></ref> | ||
| + | |||
| + | and <math>0.01-0.12 s^{-1}</math><ref name="Chatterjee2011"></ref>) | ||
| + | | In a recent publication by R.A. Cox, genomic properties and macromolecular compositions of ''Streptomyces coelicolor'' A3(2) and ''E.coli'' were reported, along with equations that connect these properties. For ''S. coelicolor'', the polypeptide elongation rate <math>ε_{aa}</math> is reported to be in the range between 0.59 and 3.17 amino acids s<sup>-1</sup>. As ScbA has 314 aa, the transcription rate constant can be calculated as per <math>P_{A}=\frac{314 aa/gene}{0.59 aa/s}=532.2 s/gene=8.87 min/gene</math> and <math>P_{A}=\frac{215 aa/gene}{3.17 aa/s}=99.1 s/gene=1.65 min/gene</math>, thus resulting in a final value of <math> 0.61 min^{-1} </math> and <math> 0.11 min^{-1} </math>. | ||
| + | <div><ul> | ||
| + | <li style="display: inline-block;"> [[Image:TR-text.png|center|thumb|700px|Cox et al. 2004<ref name="Cox2004"></ref>]] </li> | ||
| + | <li style="display: inline-block;"> [[Image:TR-text2.png|center|thumb|700px|Cox et al. 2004<ref name="Cox2004"></ref>]] </li> | ||
| + | </ul></div> | ||
| + | |||
| + | Additionally, Cox reports translation rates for ''E. coli'' between 12 and 21 aa/s. By the same calculations, the corresponding transcription rate constants are in the range <math> 2.29-4 min^{-1} </math>. | ||
| + | [[Image:PR-text.png|center|thumb|700px|Cox et al. 2004<ref name="Cox2004"></ref>]] | ||
|} | |} | ||
Revision as of 05:24, 14 October 2015
The scbA mRNA (a) is translated into ScbA protein (A).


Contents
Chemical equation

Rate equation
![r= P_{A}\cdot [a]](/wiki/images/math/d/5/c/d5c15b033aeace7c8fb306939d8bc217.png)
Parameters
The parameter of this reaction is the translation rate of ScbA ( ).The parameter values were derived from calculations of the protein translation rate based on genomic properties of Streptomyces coelicolor A3(2) and E.coli.
| Name | Value | Units | Value in previous GBL models [1] [2] | Remarks-Reference |
|---|---|---|---|---|
|
|
 [3] [3]
|

|
 [1][2] [1][2]
(Range tested: (Bistability range: and |
In a recent publication by R.A. Cox, genomic properties and macromolecular compositions of Streptomyces coelicolor A3(2) and E.coli were reported, along with equations that connect these properties. For S. coelicolor, the polypeptide elongation rate  is reported to be in the range between 0.59 and 3.17 amino acids s-1. As ScbA has 314 aa, the transcription rate constant can be calculated as per is reported to be in the range between 0.59 and 3.17 amino acids s-1. As ScbA has 314 aa, the transcription rate constant can be calculated as per 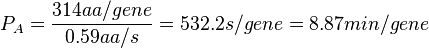 and and 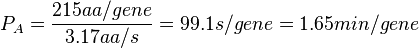 , thus resulting in a final value of , thus resulting in a final value of  and and  . .
Additionally, Cox reports translation rates for E. coli between 12 and 21 aa/s. By the same calculations, the corresponding transcription rate constants are in the range  Cox et al. 2004[3] |
 )
)


 .
.
Parameters with uncertainty
The most plausible parameter value for the  is decided to be Failed to parse (Cannot store math image on filesystem.): 0.5 min^{-1}
and the confidence interval
is decided to be Failed to parse (Cannot store math image on filesystem.): 0.5 min^{-1}
and the confidence interval  . This means that the mode of the PDF is 0.5 and the range where 95% of the values are found is between 0.05 and 5 .
The probability distribution for the parameter, adjusted accordingly in order to reflect the above values, is the following:
The location and scale parameters of the distribution are:
| Parameter | μ | σ |
|---|---|---|
|
|
Failed to parse (Cannot store math image on filesystem.): 0.1220 | 
|
References
- ↑ 1.0 1.1 1.2 S. Mehra, S. Charaniya, E. Takano, and W.-S. Hu. A bistable gene switch for antibiotic biosynthesis: The butyrolactone regulon in streptomyces coelicolor. PLoS ONE, 3(7), 2008.
- ↑ 2.0 2.1 2.2 A. Chatterjee, L. Drews, S. Mehra, E. Takano, Y.N. Kaznessis, and W.-S. Hu. Convergent transcription in the butyrolactone regulon in streptomyces coelicolor confers a bistable genetic switch for antibiotic biosynthesis. PLoS ONE, 6(7), 2011.
- ↑ 3.0 3.1 3.2 3.3 Cox RA. Quantitative relationships for specific growth rates and macromolecular compositions of Mycobacterium tuberculosis, Streptomyces coelicolor A3(2) and Escherichia coli B/r: an integrative theoretical approach. Microbiology. 2004 May;150(Pt 5):1413-26.