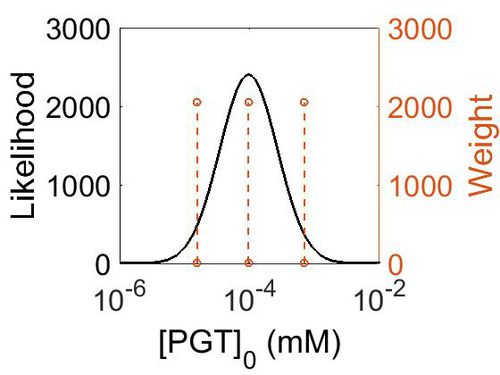
Transformation of TXA2 to exTXA2 by PGT
Rate equation
Transport Parameters
Kms
| Value | Units | Species | Notes | Weight | Reference |
|---|---|---|---|---|---|
| 0.0054 | mM | Human Eye | Vector: HEK-OATP2A1 or HEK-OATP2B1 and the respective vector controls
Substrate: Latanoprost, a prostaglandin F2a analogue pH: 7.5 Temp: 37 °C |
2048 | [1] |
| 0.000331 ± 0.000131 | mM | Transfected Human embryonic kidney cells (HEK293) | Substrate: PGE2
pH: unknown Temp: 37 °C |
512 | [2] |
| 0.007202 ± 0.000595 | mM | Transfected Human embryonic kidney cells (HEK293) | Substrate: PGE3
pH: unknown Temp: 37 °C |
512 | [2] |
| 0.000376 ± 3.4e-5 | mM | PGT-expressing Madin-Darby Canine Kidney Epithelial Cells (MDCK) cells | Substrate: PGH2
pH: unknown Temp: unknown |
192 | [3] |
| 9.40E-05 | mM | Human | Substrate: PGE2
Species: Human Vector: HeLa Cell Line pH: 7 Temperature: 27 |
1024 | [4] |
| 0.000423 | mM | Human | Substrate: TXB2
Species: Human Vector: HeLa Cell Line pH: 7 Temperature: 27 |
1024 | [4] |
| 0.007569 | mM | Human | Substrate: 6-Keto-PGF1a
Species: Human Vector: HeLa Cell Line pH: 7 Temperature: 27 |
1024 | [4] |
| 4.87E-05 | mM | Human | Substrate: PGE2
Species: Human Vector: HeLa Cell Line pH: 7 Temperature: 27 |
1024 | [5] |
| Mode (mM) | Confidence Interval | Location parameter (µ) | Scale parameter (σ) |
|---|---|---|---|
| 1.73E+01 | 4.72E+00 | 3.90E+00 | 1.02E+00 |
References
- ↑ M. Kraft The prostaglandin transporter OATP2A1 is expressed in human ocular tissues and transports the antiglaucoma prostanoid latanoprost. Invest Ophthalmol Vis Sci. 2010 May;51(5):2504-11. doi: 10.1167/iovs.09-4290. Epub 2009 Dec 17.
- ↑ 2.0 2.1 Gose T. Prostaglandin transporter (OATP2A1/SLCO2A1) contributes to local disposition of eicosapentaenoic acid-derived PGE3. Prostaglandins Other Lipid Mediat. 2016 Jan;122:10-7. doi: 10.1016/j.prostaglandins.2015.12.003. Epub 2015 Dec 10.
- ↑ Chi Y. The prostaglandin transporter PGT transports PGH2 Biochemical and Biophysical Research Communications, Volume 395, Issue 2, 30 April 2010, Pages 168–172
- ↑ 4.0 4.1 4.2 [http://science.sciencemag.org/content/sci/268/5212/866.full.pdf Kanai N. Identification and Characterization of a Prostaglandin Transporter Science 12 May 1995:Vol. 268, Issue 5212, pp. 866-869, DOI: 10.1126/science.7754369]
- ↑ Shigekazu I. Structural Determinants of Substrates for the Prostaglandin Transporter PGT Molecular Pharmacology October 1996, 50 (4) 736-742; DOI: https://doi.org/10.1124/mol.50.4.736

