Difference between revisions of "Transformation of TXA2 to TXB2"
(→Parameters) |
(→Parameters) |
||
| Line 15: | Line 15: | ||
== Parameters == | == Parameters == | ||
| + | === Association Rate Constant (Kf) === | ||
{|class="wikitable sortable" | {|class="wikitable sortable" | ||
| − | |+ style="text-align: left;" | | + | |+ style="text-align: left;" | Literature values |
|- | |- | ||
! Value | ! Value | ||
| Line 96: | Line 97: | ||
|} | |} | ||
| − | {|class="wikitable | + | {| class="wikitable" |
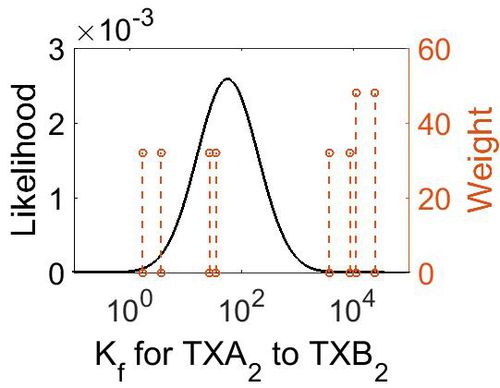
| − | |+ style="text-align: left;" | | + | |+ style="text-align: left;" | Description of the reaction 6 Kf distribution |
| + | ! Mode (M-1 s-1) !! Confidence Interval !! Location parameter (µ) !! Scale parameter (σ) | ||
|- | |- | ||
| − | + | | 3.70E+03 || 3.44E+01 || 1.10E+01 || 1.66E+00 | |
| − | + | |} | |
| − | + | ||
| − | + | [[Image:21.jpg|none|thumb|500px|The estimated probability distribution for reaction 6 Kf. The value and weight of the literature values used to define the distribution are indicated by an orange dashed line. The x axis is plotted on a log-scale. ]] | |
| − | + | ||
| − | | | + | === Dissociation Rate Constant (Kr) === |
| − | + | This is a “Dependent parameter”, meaning that the log-normal distribution for this parameter was calculated using multivariate distributions (this is discussed in detail[[Quantification of parameter uncertainty | here]]). As a result, no confidence interval factor or literature values were cited for this parameter. | |
| − | | | + | |
| − | | | + | {| class="wikitable" |
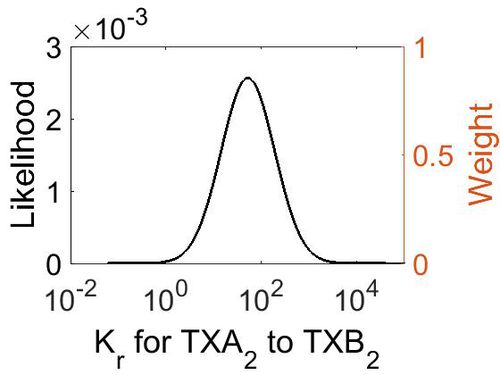
| − | | | + | |+ style="text-align: left;" | Description of the reaction 6 Kr distribution |
| − | + | ! Mode !! Location parameter (µ) !! Scale parameter (σ) | |
|- | |- | ||
| + | | 5.28E+01 || 5.63E+00 || 1.29E+00 | ||
|} | |} | ||
| + | [[Image:22.jpg|none|thumb|500px|The estimated probability distribution for reaction 6 Kr. The value and weight of the literature values used to define the distribution are indicated by an orange dashed line. The x axis is plotted on a log-scale. ]] | ||
| + | |||
| + | === Dissociation Constant === | ||
{|class="wikitable sortable" | {|class="wikitable sortable" | ||
| − | |+ style="text-align: left;" | | + | |+ style="text-align: left;" | Literature values |
|- | |- | ||
! Value | ! Value | ||
| Line 162: | Line 168: | ||
|- | |- | ||
|} | |} | ||
| + | |||
| + | {| class="wikitable" | ||
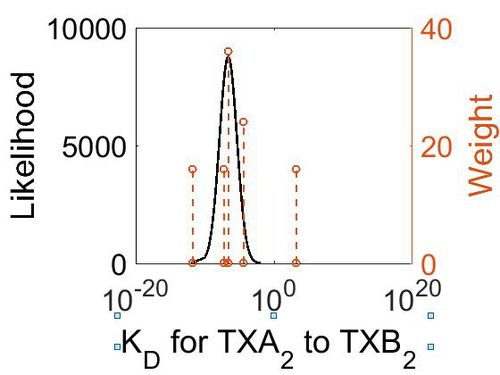
| + | |+ style="text-align: left;" | Description of the reaction 6 KD distribution | ||
| + | ! Mode (M-1 s-1) !! Confidence Interval !! Location parameter (µ) !! Scale parameter (σ) | ||
| + | |- | ||
| + | | 2.35E-07 || 1.76E+04 || -6.86E+00 || 2.90E+00 | ||
| + | |} | ||
| + | |||
| + | [[Image:R6 KD.jpg|none|thumb|500px|The estimated probability distribution for reaction 6 Kr. The value and weight of the literature values used to define the distribution are indicated by an orange dashed line. The x axis is plotted on a log-scale. ]] | ||
== Related Reactions == | == Related Reactions == | ||
Revision as of 08:37, 15 May 2019
Thromboxane A2 is a bioactive molecule which affects vasoactivity and promotes thrombosis. It is unstable due to the epoxide functional group, and as a consequence has a short half-life of 20- 30 seconds. The hydrolysis reaction results in the generation of biologically inactive TXB2.
Contents
Reaction
Chemical equation

Rate equation
Parameters
Association Rate Constant (Kf)
| Value | Units | Conditions | Substrate | Reference |
|---|---|---|---|---|
| 3.7e3 ± 0.1e3 | M-1 s-1 | NaCl04 (0.1 - 0.2 M)
Temperature: 25°C |
3 | [1] |
| 8.7e3 | M-1 s-1 | KCl (1 M)
Temperature: 25°C |
3 | [1] |
| 1.1e4 ± 0.1e4 | M-1 s-1 | NaCl04 (0.1 - 0.2 M)
Temperature: 25°C |
4 | [1] |
| 2.4 e4 | M-1 s-1 | KCl (1M)
Temperature: 25°C |
4 | [1] |
| 3.7e3 ± 0.1e3 | M-1 s-1 | NaCl04 (0.1 - 0.2 M)
Temperature: 25°C |
5 | [1] |
| 3.6 ± 0.2 | M-1 s-1 | NaCl04 (0.1 - 0.2 M)
Temperature: 25°C |
6 | [1] |
| 1.7 ± 0.1 | M-1 s-1 | NaCl04 (0.1 - 0.2 M)
Temperature: 25°C |
7 | [1] |
| 26.7 ± 0.9 | M-1 s-1 | NaCl04 (0.1 - 0.2 M)
Temperature: 25°C |
8 | [1] |
| 35 | M-1 s-1 | KCl (1M)
Temperature: 25°C |
8 | [1] |
| 2.25 ± 0.12 | M-1 min-1 | 25°C, in imidazole buffer and also in phosphate buffers, | CO2 to H2CO3 | [2] |
| Mode (M-1 s-1) | Confidence Interval | Location parameter (µ) | Scale parameter (σ) |
|---|---|---|---|
| 3.70E+03 | 3.44E+01 | 1.10E+01 | 1.66E+00 |
Dissociation Rate Constant (Kr)
This is a “Dependent parameter”, meaning that the log-normal distribution for this parameter was calculated using multivariate distributions (this is discussed in detail here). As a result, no confidence interval factor or literature values were cited for this parameter.
| Mode | Location parameter (µ) | Scale parameter (σ) |
|---|---|---|
| 5.28E+01 | 5.63E+00 | 1.29E+00 |
Dissociation Constant
| Value | Units | Conditions | Substrate | Reference |
|---|---|---|---|---|
| 0.000038 | mM | Temperature: 35°C
Vector:Mosquito Note: "In solution, it undergoes rapid hydrolysis to form TXB2, a stable but physiologically inactive compound." - therefore they used stable analogues. |
carbocyclic TXA2 (analogue of TXA2) | [3] |
| 0.00000023 | mM | Temperature: 35°C
Vector:Rabbit cultured astrocytes Note: "In solution, it undergoes rapid hydrolysis to form TXB2, a stable but physiologically inactive compound." - therefore they used stable analogues. |
[3H]IONO NT-126, a TXA z antagonist, | [4] |
| 1500 ± 500 (excluded) | mM | Temperature: 25°C
In vitro |
Hydroxysulfamic acid | [5] |
| N/A | Temperature: 20°C
In vitro |
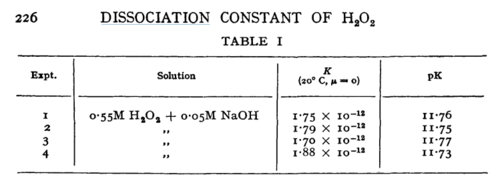
H2O2 | [5] | |
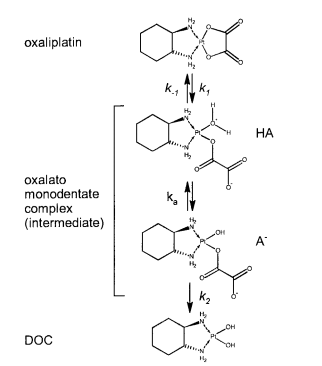
| 5.9 E-8 | N/A | Oxaliplatin | [6] |
| Mode (M-1 s-1) | Confidence Interval | Location parameter (µ) | Scale parameter (σ) |
|---|---|---|---|
| 2.35E-07 | 1.76E+04 | -6.86E+00 | 2.90E+00 |
Related Reactions
References
- ↑ 1.0 1.1 1.2 1.3 1.4 1.5 1.6 1.7 1.8 A. Ross "Vinyl epoxide hydrolysis reactions" J. Am. Chem. Soc., 1982, 104 (6), pp 1658–1665
- ↑ B. Gibbons "Rate of Hydration of Carbon Dioxide and Dehydration of Carbonic Acid at 25" J Biol Chem. 1963 Oct;238:3502-7
- ↑ P. H. Alvarenga "The Function and Three-Dimensional Structure of a Thromboxane A2/Cysteinyl Leukotriene-Binding Protein from the Saliva of a Mosquito Vector of the Malaria Parasite" PLoS Biol. 2010 Nov 30;8(11):e1000547. doi: 10.1371/journal.pbio.1000547.
- ↑ N Nakahata et al. "The Presence of Thromboxane A2 Receptors in Cultured Astrocytes From Rabbit Brain" Brain Res 583 (1-2), 100-104. 1992 Jun 26
- ↑ 5.0 5.1 D. LITTLEJOHN "The dissociation constant and acid hydrolysis rate of hydroxysulfamic acid" Can. J. Chem. 67, 1596 (1989). Cite error: Invalid
<ref>tag; name "Littlejohn1989.E2.80.9D" defined multiple times with different content - ↑ Elin Jerremalm "Hydrolysis of Oxaliplatin—Evaluation of the Acid Dissociation Constant for the Oxalato Monodentate Complex" Journal of Pharmaceutical Sciences Volume 92, Issue 2, February 2003, Pages 436–438


