Difference between revisions of "Transformation of PGE2 to 15-Keto-PGE2"
(→15-PGDH Parameters) |
|||
| (13 intermediate revisions by the same user not shown) | |||
| Line 1: | Line 1: | ||
[[Welcome to the In-Silico Model of Cutaneous Lipids Wiki | Return to overview]] | [[Welcome to the In-Silico Model of Cutaneous Lipids Wiki | Return to overview]] | ||
| + | The primary catabolic pathway of prostanoids is initiated by the oxidation of the C15 hydroxyl group by 15-prostoglandin dehydrogenase (15-PGDH). 15-PGDH can accept a wide variety of prostaglandins as substrates. Two isoforms of 15-PGDH have been recognised, Type I is NAD+ specific, whereas Type II prefers NADP+. 15-PGDH Type I is prostaglandin and lipoxin specific, whereas Type II exhibits broad substrate specificity, therefore Type I is typically referred to as 15-PGDH in the literature <ref>Ensor, C. M. Tai, H. H., ''15-Hydroxyprostaglandin dehydrogenase'', J Lipid Mediat Cell Signal (1995), 12, 313-9.</ref><ref>Wermuth, B., ''Purification and properties of an NADPH-dependent carbonyl reductase from human brain. Relationship to prostaglandin 9-ketoreductase and xenobiotic ketone reductase'', J Biol Chem (1981), 256, 1206-13.</ref>. | ||
| − | + | == Reaction == | |
| − | == Reaction == | + | [[File:R66_15PGDH.jpg|center|500px]] |
| − | |||
==Chemical equation== | ==Chemical equation== | ||
| Line 11: | Line 11: | ||
== Rate equation == | == Rate equation == | ||
| + | [[File:R66.PNG|center|500px]] | ||
| − | + | == Enzyme Parameters == | |
| − | == | + | === K<sub>ms</sub>=== |
| − | |||
| − | |||
{|class="wikitable sortable" | {|class="wikitable sortable" | ||
| − | |+ style="text-align: left;" | | + | |+ style="text-align: left;" | Literature values |
|- | |- | ||
! Value | ! Value | ||
| Line 23: | Line 22: | ||
! Species | ! Species | ||
! Notes | ! Notes | ||
| + | ! Weight | ||
! Reference | ! Reference | ||
|- | |- | ||
| Line 32: | Line 32: | ||
Temperature: 37'C | Temperature: 37'C | ||
Substrate: PGE2 + NAD+ | Substrate: PGE2 + NAD+ | ||
| + | |1024 | ||
|<ref name="Fincham1982"> [https://www.ncbi.nlm.nih.gov/pubmed/6575778 N. Fincham, Novel prostaglandin dehydrogenase in rat skin.'' Biochem J. 1983 Apr 15;212(1):129-34.]</ref> | |<ref name="Fincham1982"> [https://www.ncbi.nlm.nih.gov/pubmed/6575778 N. Fincham, Novel prostaglandin dehydrogenase in rat skin.'' Biochem J. 1983 Apr 15;212(1):129-34.]</ref> | ||
|- | |- | ||
| Line 41: | Line 42: | ||
Temperature: 37'C | Temperature: 37'C | ||
Substrate: PGE2 + NADP+ | Substrate: PGE2 + NADP+ | ||
| + | |1024 | ||
|<ref name="Fincham1982"> [https://www.ncbi.nlm.nih.gov/pubmed/6575778 N. Fincham, Novel prostaglandin dehydrogenase in rat skin.'' Biochem J. 1983 Apr 15;212(1):129-34.]</ref> | |<ref name="Fincham1982"> [https://www.ncbi.nlm.nih.gov/pubmed/6575778 N. Fincham, Novel prostaglandin dehydrogenase in rat skin.'' Biochem J. 1983 Apr 15;212(1):129-34.]</ref> | ||
|- | |- | ||
| Line 50: | Line 52: | ||
Temperature: 37'C | Temperature: 37'C | ||
Substrate: PGF2a + NAD+ | Substrate: PGF2a + NAD+ | ||
| + | |1024 | ||
|<ref name="Fincham1982"> [https://www.ncbi.nlm.nih.gov/pubmed/6575778 N. Fincham, Novel prostaglandin dehydrogenase in rat skin.'' Biochem J. 1983 Apr 15;212(1):129-34.]</ref> | |<ref name="Fincham1982"> [https://www.ncbi.nlm.nih.gov/pubmed/6575778 N. Fincham, Novel prostaglandin dehydrogenase in rat skin.'' Biochem J. 1983 Apr 15;212(1):129-34.]</ref> | ||
|- | |- | ||
| Line 59: | Line 62: | ||
Temperature: 37'C | Temperature: 37'C | ||
Substrate: PGF2a + NADP+ | Substrate: PGF2a + NADP+ | ||
| + | |1024 | ||
|<ref name="Fincham1982"> [https://www.ncbi.nlm.nih.gov/pubmed/6575778 N. Fincham, Novel prostaglandin dehydrogenase in rat skin.'' Biochem J. 1983 Apr 15;212(1):129-34.]</ref> | |<ref name="Fincham1982"> [https://www.ncbi.nlm.nih.gov/pubmed/6575778 N. Fincham, Novel prostaglandin dehydrogenase in rat skin.'' Biochem J. 1983 Apr 15;212(1):129-34.]</ref> | ||
|- | |- | ||
| + | |0.0039 | ||
| + | |<math> mM </math> | ||
| + | |Purified Human 15-PGDH | ||
| + | |Method: In vitro | ||
| + | Expression Vector: E. coli | ||
| + | pH:7.5 | ||
| + | Temperature: 37'C | ||
| + | Substrate: PGE2 | ||
| + | |1024 | ||
| + | |<ref name="Zhou2001"> [http://onlinelibrary.wiley.com/doi/10.1046/j.1432-1327.2001.02218.x/epdf Zhou H., C-Terminal region of human NAD+-dependent 15-hydroxyprostaglandin dehydrogenase is involved in the interaction with prostaglandin substrates.'' Eur J Biochem. 2001 Jun;268(12):3368-74.]</ref> | ||
| + | |- | ||
| + | |0.0099 | ||
| + | |<math> mM </math> | ||
| + | |Purified Rat 15-PGDH | ||
| + | |Method: In vitro | ||
| + | Expression Vector: E. coli | ||
| + | pH:7.5 | ||
| + | Temperature: 37'C | ||
| + | Substrate: PGE2 | ||
| + | |512 | ||
| + | |<ref name="Zhou2001"> [http://onlinelibrary.wiley.com/doi/10.1046/j.1432-1327.2001.02218.x/epdf Zhou H., C-Terminal region of human NAD+-dependent 15-hydroxyprostaglandin dehydrogenase is involved in the interaction with prostaglandin substrates.'' Eur J Biochem. 2001 Jun;268(12):3368-74.]</ref> | ||
| + | |- | ||
| + | |0.0055 ± 0.0006 | ||
| + | |<math> mM </math> | ||
| + | |Human | ||
| + | |Method:In vitro | ||
| + | Expression Vector: E. Coli | ||
| + | pH:8 | ||
| + | Temperature: 25 | ||
| + | Substrate: PGE2 + NAD+ | ||
| + | |1024 | ||
| + | |<ref name="Niesen2010"> [http://journals.plos.org/plosone/article?id=10.1371/journal.pone.0013719 F. Niesen,, High-Affinity Inhibitors of Human NAD+-Dependent 15-Hydroxyprostaglandin Dehydrogenase: Mechanisms of Inhibition and Structure-Activity Relationships'' PLoS One. 2010 Nov 2;5(11):e13719.]</ref> | ||
| + | |- | ||
| + | |} | ||
| + | |||
| + | {| class="wikitable" | ||
| + | |+ style="text-align: left;" | Description of the 15-PGDH Kms distribution | ||
| + | ! Mode (mM) !! Confidence Interval !! Location parameter (μ) !! Scale parameter (σ) | ||
| + | |- | ||
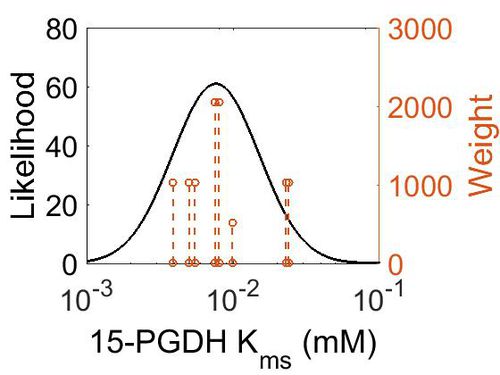
| + | | 7.64E-03 || 5.05E+00 || -4.41E+00 || 6.80E-01 | ||
|} | |} | ||
| + | [[Image:73.jpg|none|thumb|500px|The estimated probability distribution for 15-PGDH Kms. The value and weight of the literature values used to define the distribution are indicated by an orange dashed line. The x axis is plotted on a log-scale. ]] | ||
| + | ===K<sub>mp</sub>=== | ||
| + | {| class="wikitable" | ||
| + | |+ style="text-align: left;" | Description of the 15-PGDH Kmp distribution | ||
| + | ! Mode (mM) !! Location parameter (μ) !! Scale parameter (σ) | ||
| + | |- | ||
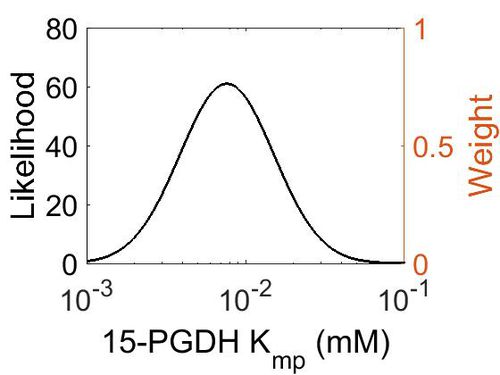
| + | | 7.70E-03 || -4.41E+00 || 6.72E-01 | ||
| + | |} | ||
| + | |||
| + | [[Image:74.jpg|none|thumb|500px|The estimated probability distribution for 15-PGDH Kmp. The value and weight of the literature values used to define the distribution are indicated by an orange dashed line. The x axis is plotted on a log-scale. ]] | ||
| + | |||
| + | ===k<sub>cat</sub>=== | ||
{|class="wikitable sortable" | {|class="wikitable sortable" | ||
| − | |+ style="text-align: left;" | | + | |+ style="text-align: left;" | Literature values |
|- | |- | ||
! Value | ! Value | ||
| Line 71: | Line 127: | ||
! Species | ! Species | ||
! Notes | ! Notes | ||
| + | ! Weight | ||
! Reference | ! Reference | ||
|- | |- | ||
| − | | | + | |816 ± 18 |
| + | |<math> per minute </math> | ||
| + | |Human | ||
| + | |Method: In vitro | ||
| + | Expression Vector: E. Coli | ||
| + | pH:8 | ||
| + | Temperature: 25 | ||
| + | Substrate: PGE2 + NAD+ | ||
| + | |128 | ||
| + | |<ref name="Niesen2010"> [http://journals.plos.org/plosone/article?id=10.1371/journal.pone.0013719 F. Niesen,, High-Affinity Inhibitors of Human NAD+-Dependent 15-Hydroxyprostaglandin Dehydrogenase: Mechanisms of Inhibition and Structure-Activity Relationships'' PLoS One. 2010 Nov 2;5(11):e13719.]</ref> | ||
| + | |- | ||
| + | |366 ± 12 - 846 ± 12 | ||
|<math> per minute </math> | |<math> per minute </math> | ||
| − | | | + | |Human |
| − | | | + | |Method: In vitro |
| − | | | + | Expression Vector: E. Coli |
| + | pH:8 | ||
| + | Temperature: 25 | ||
| + | Substrate: PGE2 + NAD+ + Inhibitor | ||
| + | |128 | ||
| + | |<ref name="Niesen2010"> [http://journals.plos.org/plosone/article?id=10.1371/journal.pone.0013719 F. Niesen,, High-Affinity Inhibitors of Human NAD+-Dependent 15-Hydroxyprostaglandin Dehydrogenase: Mechanisms of Inhibition and Structure-Activity Relationships'' PLoS One. 2010 Nov 2;5(11):e13719.]</ref> | ||
| + | |- | ||
| + | |} | ||
| + | |||
| + | {| class="wikitable" | ||
| + | |+ style="text-align: left;" | Description of the 15-PGDH kcat distribution | ||
| + | ! Mode (min-1) !! Confidence Interval !! Location parameter (μ) !! Scale parameter (σ) | ||
|- | |- | ||
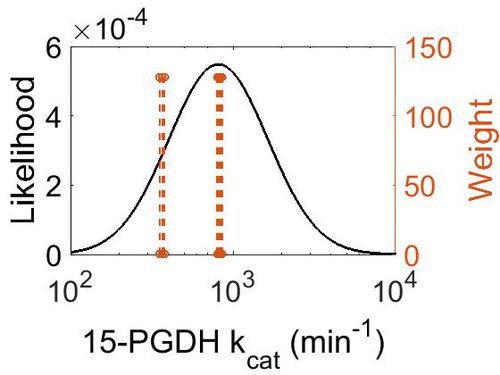
| + | | 8.12E+02 || 5.38E+00 || 7.19E+00 || 7.01E-01 | ||
|} | |} | ||
| + | |||
| + | [[Image:75.jpg|none|thumb|500px|The estimated probability distribution for 15-PGDH kcat. The value and weight of the literature values used to define the distribution are indicated by an orange dashed line. The x axis is plotted on a log-scale. ]] | ||
| + | |||
| + | ===Enzyme concentration === | ||
| + | |||
| + | To convert the enzyme concentration from ppm to mM, the following [[Common equations#Enzyme concentration (mM)|equation]] was used. | ||
{|class="wikitable sortable" | {|class="wikitable sortable" | ||
| − | |+ style="text-align: left;" | | + | |+ style="text-align: left;" | Literature values |
|- | |- | ||
! Value | ! Value | ||
| Line 88: | Line 174: | ||
! Species | ! Species | ||
! Notes | ! Notes | ||
| + | ! Weight | ||
! Reference | ! Reference | ||
|- | |- | ||
| − | | | + | |69.8 |
|<math> ppm </math> | |<math> ppm </math> | ||
| − | | | + | |Human |
| − | | | + | |Expression Vector: Esophagus |
| − | | | + | Enzyme: 15-PGDH |
| + | pH: 7.5 | ||
| + | Temperature: 37 °C | ||
| + | |1024 | ||
| + | |<ref name="Wilhelm2014"> [http://www.nature.com/nature/journal/v509/n7502/pdf/nature13319.pdf M. Wilhelm ''Mass-spectrometry-based draft of the human proteome'' Nature, 2014 509, 582–587]</ref> | ||
|- | |- | ||
| + | |22.1 | ||
| + | |<math> ppm </math> | ||
| + | |Human | ||
| + | |Expression Vector: Heart | ||
| + | Enzyme: 15-PGDH | ||
| + | pH: 7.5 | ||
| + | Temperature: 37 °C | ||
| + | |1024 | ||
| + | |<ref name="Kim2014"> [http://www.nature.com/nature/journal/v509/n7502/pdf/nature13302.pdf M. Kim ''A draft map of the human proteome'' Nature, 2014 509, 575–581]</ref> | ||
| + | |- | ||
| + | |11.2 | ||
| + | |<math> ppm </math> | ||
| + | |Human | ||
| + | |Expression Vector: Esophagus | ||
| + | Enzyme: 15-PGDH | ||
| + | pH: 7.5 | ||
| + | Temperature: 37 °C | ||
| + | |1024 | ||
| + | |<ref name="Kim2014"> [http://www.nature.com/nature/journal/v509/n7502/pdf/nature13302.pdf M. Kim ''A draft map of the human proteome'' Nature, 2014 509, 575–581]</ref> | ||
| + | |- | ||
| + | |7.68 | ||
| + | |<math> ppm </math> | ||
| + | |Human | ||
| + | |Expression Vector: Skin | ||
| + | Enzyme: 15-PGDH | ||
| + | pH: 7.5 | ||
| + | Temperature: 37 °C | ||
| + | |2048 | ||
| + | |Paxdb - Unknown | ||
| + | |} | ||
| + | |||
| + | {| class="wikitable" | ||
| + | |+ style="text-align: left;" | Description of the 15-PGDH concentration distribution | ||
| + | ! Mode (ppm) !! Mode (mM) !! Confidence Interval !! Location parameter (μ) !! Scale parameter (σ) | ||
| + | |- | ||
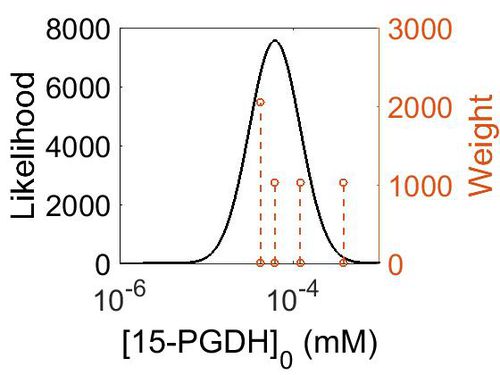
| + | | 1.12E+01 || 6.20E-05 || 2.32E+00 || 2.87E+00 || 6.80E-01 | ||
|} | |} | ||
| + | [[Image:152.jpg|none|thumb|500px|The estimated probability distribution for 15-PGDH concentration. The value and weight of the literature values used to define the distribution are indicated by an orange dashed line. The x axis is plotted on a log-scale. ]] | ||
| + | |||
| + | ===K<sub>eq</sub>=== | ||
{|class="wikitable sortable" | {|class="wikitable sortable" | ||
|+ style="text-align: left;" | Gibbs Free Energy Change | |+ style="text-align: left;" | Gibbs Free Energy Change | ||
| Line 105: | Line 235: | ||
! Species | ! Species | ||
! Notes | ! Notes | ||
| + | ! Weight | ||
! Reference | ! Reference | ||
|- | |- | ||
| − | | | + | |(-0.46818542) |
| − | | | + | |kcal/mol |
| − | | | + | |Calculated |
| − | | | + | |Estimated |
| − | | | + | Enzyme: 15-PGDH |
| + | Substrate: PGE2 | ||
| + | Product: 15-dehydro-PGE2 | ||
| + | pH: 7.3 | ||
| + | ionic strength: 0.25 | ||
| + | |64 | ||
| + | |<ref name="MetaCyc”>[http://metacyc.org/META/NEW-IMAGE?type=REACTION&object=ARACHIDONATE-12-LIPOXYGENASE-RXN Caspi et al 2014, "The MetaCyc database of metabolic pathways and enzymes and the BioCyc collection of Pathway/Genome Databases," Nucleic Acids Research 42:D459-D471]</ref> | ||
|} | |} | ||
| + | |||
| + | {| class="wikitable" | ||
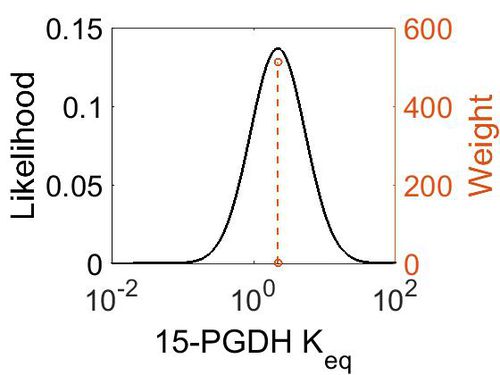
| + | |+ style="text-align: left;" | Description of the 15-PGDH Keq distribution | ||
| + | ! Mode !! Confidence Interval !! Location parameter (μ) !! Scale parameter (σ) | ||
| + | |- | ||
| + | | 2.21E+00 || 1.00E+01 || 1.58E+00 || 8.91E-01 | ||
| + | |} | ||
| + | |||
| + | [[Image:76.jpg|none|thumb|500px|The estimated probability distribution for 15-PGDH Keq. The value and weight of the literature values used to define the distribution are indicated by an orange dashed line. The x axis is plotted on a log-scale. ]] | ||
== References == | == References == | ||
<references/> | <references/> | ||
Latest revision as of 08:57, 21 August 2019
The primary catabolic pathway of prostanoids is initiated by the oxidation of the C15 hydroxyl group by 15-prostoglandin dehydrogenase (15-PGDH). 15-PGDH can accept a wide variety of prostaglandins as substrates. Two isoforms of 15-PGDH have been recognised, Type I is NAD+ specific, whereas Type II prefers NADP+. 15-PGDH Type I is prostaglandin and lipoxin specific, whereas Type II exhibits broad substrate specificity, therefore Type I is typically referred to as 15-PGDH in the literature [1][2].
Contents
Reaction
Chemical equation

Rate equation
Enzyme Parameters
Kms
| Value | Units | Species | Notes | Weight | Reference |
|---|---|---|---|---|---|
| 0.008 | 
|
Rat Skin | Method:
pH:7.4 Temperature: 37'C Substrate: PGE2 + NAD+ |
1024 | [3] |
| 0.0075 | 
|
Rat Skin | Method:
pH:7.4 Temperature: 37'C Substrate: PGE2 + NADP+ |
1024 | [3] |
| 0.024 | 
|
Rat Skin | Method:
pH:7.4 Temperature: 37'C Substrate: PGF2a + NAD+ |
1024 | [3] |
| 0.023 | 
|
Rat Skin | Method:
pH:7.4 Temperature: 37'C Substrate: PGF2a + NADP+ |
1024 | [3] |
| 0.0039 | 
|
Purified Human 15-PGDH | Method: In vitro
Expression Vector: E. coli pH:7.5 Temperature: 37'C Substrate: PGE2 |
1024 | [4] |
| 0.0099 | 
|
Purified Rat 15-PGDH | Method: In vitro
Expression Vector: E. coli pH:7.5 Temperature: 37'C Substrate: PGE2 |
512 | [4] |
| 0.0055 ± 0.0006 | 
|
Human | Method:In vitro
Expression Vector: E. Coli pH:8 Temperature: 25 Substrate: PGE2 + NAD+ |
1024 | [5] |
| Mode (mM) | Confidence Interval | Location parameter (μ) | Scale parameter (σ) |
|---|---|---|---|
| 7.64E-03 | 5.05E+00 | -4.41E+00 | 6.80E-01 |
Kmp
| Mode (mM) | Location parameter (μ) | Scale parameter (σ) |
|---|---|---|
| 7.70E-03 | -4.41E+00 | 6.72E-01 |
kcat
| Value | Units | Species | Notes | Weight | Reference |
|---|---|---|---|---|---|
| 816 ± 18 | 
|
Human | Method: In vitro
Expression Vector: E. Coli pH:8 Temperature: 25 Substrate: PGE2 + NAD+ |
128 | [5] |
| 366 ± 12 - 846 ± 12 | 
|
Human | Method: In vitro
Expression Vector: E. Coli pH:8 Temperature: 25 Substrate: PGE2 + NAD+ + Inhibitor |
128 | [5] |
| Mode (min-1) | Confidence Interval | Location parameter (μ) | Scale parameter (σ) |
|---|---|---|---|
| 8.12E+02 | 5.38E+00 | 7.19E+00 | 7.01E-01 |
Enzyme concentration
To convert the enzyme concentration from ppm to mM, the following equation was used.
| Value | Units | Species | Notes | Weight | Reference |
|---|---|---|---|---|---|
| 69.8 | 
|
Human | Expression Vector: Esophagus
Enzyme: 15-PGDH pH: 7.5 Temperature: 37 °C |
1024 | [6] |
| 22.1 | 
|
Human | Expression Vector: Heart
Enzyme: 15-PGDH pH: 7.5 Temperature: 37 °C |
1024 | [7] |
| 11.2 | 
|
Human | Expression Vector: Esophagus
Enzyme: 15-PGDH pH: 7.5 Temperature: 37 °C |
1024 | [7] |
| 7.68 | 
|
Human | Expression Vector: Skin
Enzyme: 15-PGDH pH: 7.5 Temperature: 37 °C |
2048 | Paxdb - Unknown |
| Mode (ppm) | Mode (mM) | Confidence Interval | Location parameter (μ) | Scale parameter (σ) |
|---|---|---|---|---|
| 1.12E+01 | 6.20E-05 | 2.32E+00 | 2.87E+00 | 6.80E-01 |
Keq
| Value | Units | Species | Notes | Weight | Reference |
|---|---|---|---|---|---|
| (-0.46818542) | kcal/mol | Calculated | Estimated
Enzyme: 15-PGDH Substrate: PGE2 Product: 15-dehydro-PGE2 pH: 7.3 ionic strength: 0.25 |
64 | [8] |
| Mode | Confidence Interval | Location parameter (μ) | Scale parameter (σ) |
|---|---|---|---|
| 2.21E+00 | 1.00E+01 | 1.58E+00 | 8.91E-01 |
References
- ↑ Ensor, C. M. Tai, H. H., 15-Hydroxyprostaglandin dehydrogenase, J Lipid Mediat Cell Signal (1995), 12, 313-9.
- ↑ Wermuth, B., Purification and properties of an NADPH-dependent carbonyl reductase from human brain. Relationship to prostaglandin 9-ketoreductase and xenobiotic ketone reductase, J Biol Chem (1981), 256, 1206-13.
- ↑ 3.0 3.1 3.2 3.3 N. Fincham, Novel prostaglandin dehydrogenase in rat skin. Biochem J. 1983 Apr 15;212(1):129-34.
- ↑ 4.0 4.1 Zhou H., C-Terminal region of human NAD+-dependent 15-hydroxyprostaglandin dehydrogenase is involved in the interaction with prostaglandin substrates. Eur J Biochem. 2001 Jun;268(12):3368-74.
- ↑ 5.0 5.1 5.2 F. Niesen,, High-Affinity Inhibitors of Human NAD+-Dependent 15-Hydroxyprostaglandin Dehydrogenase: Mechanisms of Inhibition and Structure-Activity Relationships PLoS One. 2010 Nov 2;5(11):e13719.
- ↑ M. Wilhelm Mass-spectrometry-based draft of the human proteome Nature, 2014 509, 582–587
- ↑ 7.0 7.1 M. Kim A draft map of the human proteome Nature, 2014 509, 575–581
- ↑ Caspi et al 2014, "The MetaCyc database of metabolic pathways and enzymes and the BioCyc collection of Pathway/Genome Databases," Nucleic Acids Research 42:D459-D471


