Difference between revisions of "Transformation of AA to 5-HPETE"
(→Parameters) |
(→Enzyme concentration) |
||
| Line 118: | Line 118: | ||
=== Enzyme concentration === | === Enzyme concentration === | ||
| + | |||
| + | To convert the enzyme concentration from ppm to mM, the following [[Common equations#Enzyme concentration (mM)|equation]] was used. | ||
| + | |||
{|class="wikitable sortable" | {|class="wikitable sortable" | ||
|+ style="text-align: left;" | Literature values | |+ style="text-align: left;" | Literature values | ||
| Line 162: | Line 165: | ||
{| class="wikitable" | {| class="wikitable" | ||
|+ style="text-align: left;" | Description of the 5-LOX concentration distribution | |+ style="text-align: left;" | Description of the 5-LOX concentration distribution | ||
| − | ! Mode (mM) !! Confidence Interval !! Location parameter (µ) !! Scale parameter (σ) | + | ! Mode (ppm) !! Mode (mM) !! Confidence Interval !! Location parameter (µ) !! Scale parameter (σ) |
|- | |- | ||
| − | | 4.96E+01 || 1.60E+00 || 4.09E+00 || 4.28E-01 | + | | 4.96E+01 || 2.74E-04|| 1.60E+00 || 4.09E+00 || 4.28E-01 |
|} | |} | ||
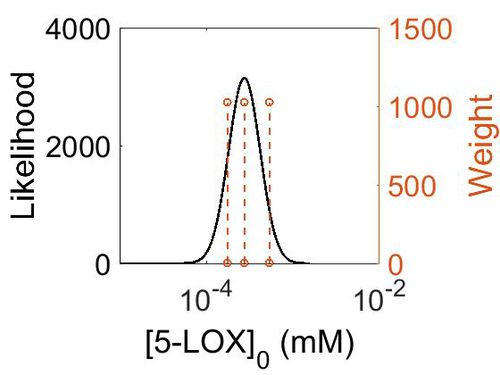
[[Image:158.jpg|none|thumb|500px|The estimated probability distribution for 5-LOX concentration. The value and weight of the literature values used to define the distribution are indicated by an orange dashed line. The x axis is plotted on a log-scale. ]] | [[Image:158.jpg|none|thumb|500px|The estimated probability distribution for 5-LOX concentration. The value and weight of the literature values used to define the distribution are indicated by an orange dashed line. The x axis is plotted on a log-scale. ]] | ||
| − | |||
=== K<sub>eq</sub> === | === K<sub>eq</sub> === | ||
Revision as of 10:35, 30 May 2019
ALOX5 encodes the protein 5-LOX, which is responsible for the generation of 5-HPETE. This protein shuttles between the cytoplasm and the nucleus and has been detected in the nucleus matrix, the nucleus membrane, the peripheral membrane and the cytoplasm.
The formation of the hydroperoxy fatty acids begins with the abstraction of a hydrogen radical at the allylic position between two double bonds. The structure undergoes a rearrangement reaction which results in the formation of a conjugated diene system. The insertion of molecular oxygen and a hydrogen leads to the formation of the final structure, a hydroperoxy fatty acid.
5-LOX activity in the skin remains a mystery. The enzyme has a low levels of activity in cutaneous cells, but products of the pathway such as leukotrienes and 5-HETE are always detected in human skin tissue (Breton, Woolf et al. 1996). As with various prostaglandins found in the compartment, it has been suggested that the detected 5-LOX metabolites are as a result of infiltrating cells from the vascular compartment (Kowal-Bielecka, Distler et al. 2001, Kanaoka and Boyce 2004).
Contents
Reaction
Chemical equation

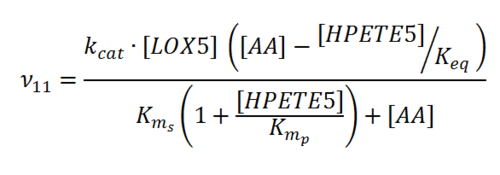
Rate equation
Parameters
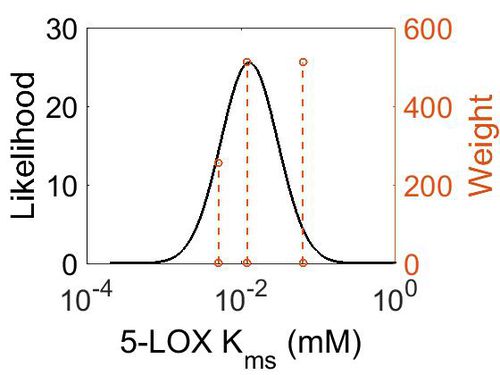
Kms
| Value | Units | Species | Notes | Weight | Reference |
|---|---|---|---|---|---|
| 5.10E-03 | 
|
Human | Expression Vector: Baculovirus, Sf9 insect cells
Enzyme: Recombinant 5-Lipoxygenase pH: 5.6 Temperature:37 |
256 | [1] |
| 1.20E-02 | 
|
Human | Expression Vector: Polymorphonuclear Leukocytes
Enzyme: 5-Lipoxygenase pH:7.5 Temperature: 22 |
512 | [2] |
| 6.31E-02 | 
|
Human | Expression Vector: Polymorphonuclear Leukocytes
Enzyme: 5-Lipoxygenase pH:7.5 Temperature: 22 |
512 | [3] |
| Mode (mM) | Confidence Interval | Location parameter (µ) | Scale parameter (σ) |
|---|---|---|---|
| 1.27E-02 | 2.74E+00 | -3.76E+00 | 7.73E-01 |
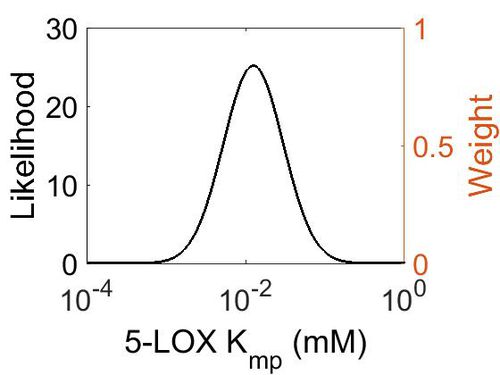
Kmp
| Mode (mM) | Location parameter (µ) | Scale parameter (σ) |
|---|---|---|
| 1.25E-02 | -3.63E+00 | 8.68E-01 |
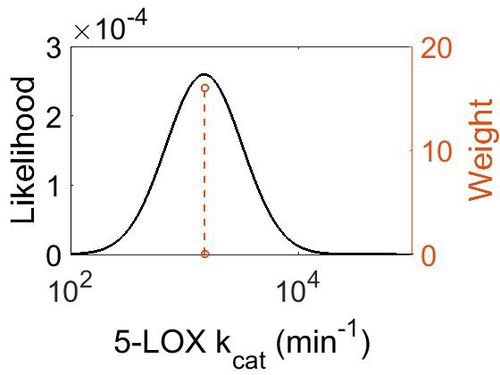
kcat
| Value | Units | Species | Notes | Weight | Reference |
|---|---|---|---|---|---|
| 1500 + 75 | per minute | Potato | Expression Vector:Potato Tubers
Enzyme: 5-Lipoxygenase pH:5.5 Temperature: 23 |
16 | [4] |
| Mode (min-1) | Confidence Interval | Location parameter (µ) | Scale parameter (σ) |
|---|---|---|---|
| 1.50E+03 | 1.05E+00 | 7.31E+00 | 4.99E-02 |
Enzyme concentration
To convert the enzyme concentration from ppm to mM, the following equation was used.
| Value | Units | Species | Notes | Weight | Reference |
|---|---|---|---|---|---|
| 97.3 | 
|
Human | Expression Vector: Lung
Enzyme: 5-LOX pH: 7.5 Temperature: 37 °C |
1024 | [5] |
| 49.8 | 
|
Human | Expression Vector: Esophagus
Enzyme: 5-LOX pH: 7.5 Temperature: 37 °C |
1024 | [6] |
| 31.9 | 
|
Human | Expression Vector: Oral Cavity
Enzyme: 5-LOX pH: 7.5 Temperature: 37 °C |
1024 | [6] |
| Mode (ppm) | Mode (mM) | Confidence Interval | Location parameter (µ) | Scale parameter (σ) |
|---|---|---|---|---|
| 4.96E+01 | 2.74E-04 | 1.60E+00 | 4.09E+00 | 4.28E-01 |
Keq
| Gibbs Free Energy Change | Units | Species | Notes | Weight | Reference |
|---|---|---|---|---|---|
| (-15.9) - 18.01 | kcal/mol | Soybean | Expression Vector: Soybean
Enzyme: Lipoxygenase-1 pH:Not stated Temperature: Not stated |
8 | [7] |
| (-69.979996) | kcal/mol | Not stated | Estimated
Enzyme: 5-Lipoxygenase Substrate: Arachidonate Product: 5-HPETE pH: 7.3 ionic strength: 0.25 |
64 | [8] |
| Mode | Confidence Interval | Location parameter (µ) | Scale parameter (σ) |
|---|---|---|---|
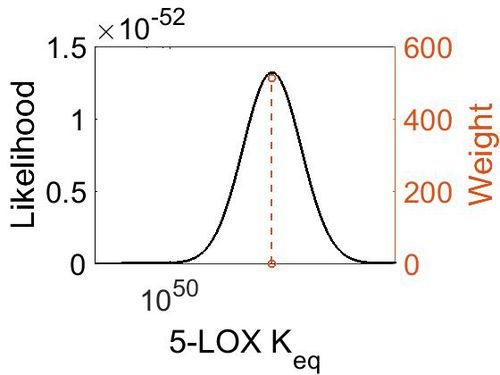
| 2.27E+51 | 1.00E+01 | 1.19E+02 | 8.90E-01 |
References
- ↑ Shirumalla R. K. “RBx 7,796: A novel inhibitor of 5-lipoxygenase.” Inflamm Res. 2006 Dec ; 55 (12) : 517-27.
- ↑ Soberman R. J. "5- and 15(omega-6)-lipoxygenases from human polymorphonuclear leukocytes. Methods Enzymol. 1988; 163:344-9.
- ↑ Soberman R. J. “Characterization and separation of the arachidonic acid 5-lipoxygenase and linoleic acid omega-6 lipoxygenase (arachidonic acid 15-lipoxygenase) of human polymorphonuclear leukocytes.” J Biol Chem. 1985 Apr 10;260(7):4508-15.
- ↑ Mulliez E., “5-Lipoxygenase from potato tubers. Improved purification and physicochemical characteristics” Biochimica et Biophysica Acta, 1987;916(1):13-23.
- ↑ M. Kim A draft map of the human proteome Nature, 2014 509, 575–581
- ↑ 6.0 6.1 M. Wilhelm Mass-spectrometry-based draft of the human proteome Nature, 2014 509, 582–587
- ↑ [http://pubs.acs.org/doi/pdf/10.1021/jp040114n Tejero I., “Hydrogen Abstraction by Soybean Lipoxygenase-1. Density Functional Theory Study on Active Site Models in Terms of Gibbs Free Energies” J. Phys. Chem. B, 2004, 108 (36), pp 13831–13838]
- ↑ Caspi et al 2014, "The MetaCyc database of metabolic pathways and enzymes and the BioCyc collection of Pathway/Genome Databases," Nucleic Acids Research 42:D459-D471

