Difference between revisions of "Transformation of AA to 5-HPETE"
(→5-LOX Parameters) |
|||
| (14 intermediate revisions by the same user not shown) | |||
| Line 1: | Line 1: | ||
[[Welcome to the In-Silico Model of Cutaneous Lipids Wiki | Return to overview]] | [[Welcome to the In-Silico Model of Cutaneous Lipids Wiki | Return to overview]] | ||
| + | |||
| + | ALOX5 encodes the protein 5-LOX, which is responsible for the generation of 5-HPETE. The formation of the unstable hydroperoxy fatty acids (HPETE) begins with the abstraction of a hydrogen radical at the allylic position between two double bonds. The structure undergoes a rearrangement reaction which results in the formation of a conjugated diene system. The insertion of molecular oxygen and a hydrogen leads to the formation of the final structure, a hydroperoxy fatty acid. | ||
| + | |||
== Reaction == | == Reaction == | ||
| − | |||
[[File:R11_AA_-_HPETE5.jpg |center|500px]] | [[File:R11_AA_-_HPETE5.jpg |center|500px]] | ||
| Line 10: | Line 12: | ||
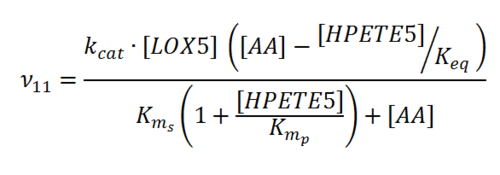
== Rate equation == | == Rate equation == | ||
| + | [[File:R11.PNG|center|500px]] | ||
| − | == | + | == Parameters == |
| − | + | === K<sub>ms</sub> === | |
{|class="wikitable sortable" | {|class="wikitable sortable" | ||
| − | |+ style="text-align: left;" | | + | |+ style="text-align: left;" | Literature values |
|- | |- | ||
! Value | ! Value | ||
| Line 21: | Line 24: | ||
! Species | ! Species | ||
! Notes | ! Notes | ||
| + | ! Weight | ||
! Reference | ! Reference | ||
|- | |- | ||
| Line 30: | Line 34: | ||
pH: 5.6 | pH: 5.6 | ||
Temperature:37 | Temperature:37 | ||
| + | |256 | ||
|<ref name="Shirumalla2006”>[http://www.ncbi.nlm.nih.gov/pubmed/17039282 Shirumalla R. K. “RBx 7,796: A novel inhibitor of 5-lipoxygenase.” Inflamm Res. 2006 Dec ; 55 (12) : 517-27.]</ref> | |<ref name="Shirumalla2006”>[http://www.ncbi.nlm.nih.gov/pubmed/17039282 Shirumalla R. K. “RBx 7,796: A novel inhibitor of 5-lipoxygenase.” Inflamm Res. 2006 Dec ; 55 (12) : 517-27.]</ref> | ||
|- | |- | ||
| Line 39: | Line 44: | ||
pH:7.5 | pH:7.5 | ||
Temperature: 22 | Temperature: 22 | ||
| + | |512 | ||
|<ref name="Soberman1988"> [http://www.ncbi.nlm.nih.gov/pubmed/3070300 Soberman R. J. "5- and 15(omega-6)-lipoxygenases from human polymorphonuclear leukocytes.'' Methods Enzymol. 1988; 163:344-9.]</ref> | |<ref name="Soberman1988"> [http://www.ncbi.nlm.nih.gov/pubmed/3070300 Soberman R. J. "5- and 15(omega-6)-lipoxygenases from human polymorphonuclear leukocytes.'' Methods Enzymol. 1988; 163:344-9.]</ref> | ||
|- | |- | ||
| Line 48: | Line 54: | ||
pH:7.5 | pH:7.5 | ||
Temperature: 22 | Temperature: 22 | ||
| + | |512 | ||
|<ref name="Soberman1985”>[http://www.ncbi.nlm.nih.gov/pubmed/3920219 Soberman R. J. “Characterization and separation of the arachidonic acid 5-lipoxygenase and linoleic acid omega-6 lipoxygenase (arachidonic acid 15-lipoxygenase) of human polymorphonuclear leukocytes.” J Biol Chem. 1985 Apr 10;260(7):4508-15.]</ref> | |<ref name="Soberman1985”>[http://www.ncbi.nlm.nih.gov/pubmed/3920219 Soberman R. J. “Characterization and separation of the arachidonic acid 5-lipoxygenase and linoleic acid omega-6 lipoxygenase (arachidonic acid 15-lipoxygenase) of human polymorphonuclear leukocytes.” J Biol Chem. 1985 Apr 10;260(7):4508-15.]</ref> | ||
|- | |- | ||
|} | |} | ||
| + | {| class="wikitable" | ||
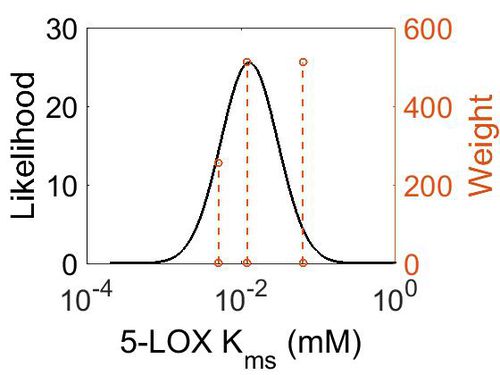
| + | |+ style="text-align: left;" | Description of the 5-LOX Kms distribution | ||
| + | ! Mode (mM) !! Confidence Interval !! Location parameter (µ) !! Scale parameter (σ) | ||
| + | |- | ||
| + | | 1.27E-02 || 2.74E+00 || -3.76E+00 || 7.73E-01 | ||
| + | |} | ||
| + | |||
| + | [[Image:33.jpg|none|thumb|500px|The estimated probability distribution for 5-LOX Kms. The value and weight of the literature values used to define the distribution are indicated by an orange dashed line. The x axis is plotted on a log-scale. ]] | ||
| + | |||
| + | === K<sub>mp</sub>=== | ||
| + | {| class="wikitable" | ||
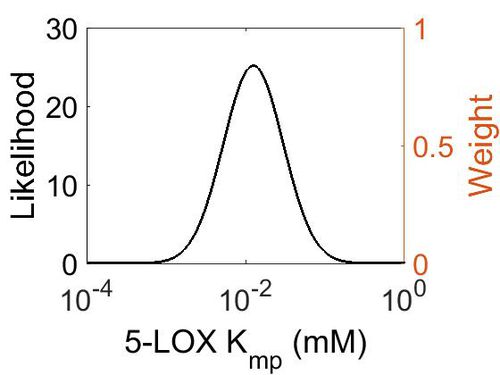
| + | |+ style="text-align: left;" | Description of the 5-LOX Kmp distribution | ||
| + | ! Mode (mM) !! Location parameter (µ) !! Scale parameter (σ) | ||
| + | |- | ||
| + | | 1.25E-02 || -3.63E+00 || 8.68E-01 | ||
| + | |} | ||
| + | |||
| + | [[Image:34.jpg|none|thumb|500px|The estimated probability distribution for 5-LOX Kmp. The value and weight of the literature values used to define the distribution are indicated by an orange dashed line. The x axis is plotted on a log-scale. ]] | ||
| + | |||
| + | |||
| + | === k<sub>cat</sub> === | ||
{|class="wikitable sortable" | {|class="wikitable sortable" | ||
| − | |+ style="text-align: left;" | | + | |+ style="text-align: left;" | Literature values |
|- | |- | ||
! Value | ! Value | ||
| Line 59: | Line 87: | ||
! Species | ! Species | ||
! Notes | ! Notes | ||
| + | ! Weight | ||
! Reference | ! Reference | ||
|- | |- | ||
| Line 68: | Line 97: | ||
pH:5.5 | pH:5.5 | ||
Temperature: 23 | Temperature: 23 | ||
| + | |16 | ||
|<ref name="Mulliez1987”>[http://www.sciencedirect.com/science/article/pii/0167483887902056 Mulliez E., “5-Lipoxygenase from potato tubers. Improved purification and physicochemical characteristics” Biochimica et Biophysica Acta, 1987;916(1):13-23.]</ref> | |<ref name="Mulliez1987”>[http://www.sciencedirect.com/science/article/pii/0167483887902056 Mulliez E., “5-Lipoxygenase from potato tubers. Improved purification and physicochemical characteristics” Biochimica et Biophysica Acta, 1987;916(1):13-23.]</ref> | ||
|- | |- | ||
| Line 73: | Line 103: | ||
|} | |} | ||
| + | {| class="wikitable" | ||
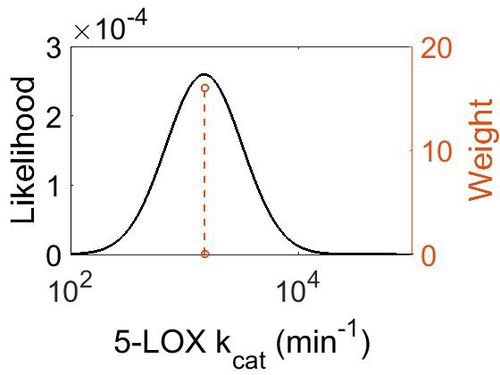
| + | |+ style="text-align: left;" | Description of the 5-LOX kcat distribution | ||
| + | ! Mode (min-1) !! Confidence Interval !! Location parameter (µ) !! Scale parameter (σ) | ||
| + | |- | ||
| + | | 1.50E+03 || 1.05E+00 || 7.31E+00 || 4.99E-02 | ||
| + | |} | ||
| + | |||
| + | [[Image:35.jpg|none|thumb|500px|The estimated probability distribution for 5-LOX kcat. The value and weight of the literature values used to define the distribution are indicated by an orange dashed line. The x axis is plotted on a log-scale. ]] | ||
| + | |||
| + | |||
| + | === Enzyme concentration === | ||
| + | |||
| + | To convert the enzyme concentration from ppm to mM, the following [[Common equations#Enzyme concentration (mM)|equation]] was used. | ||
{|class="wikitable sortable" | {|class="wikitable sortable" | ||
| − | |+ style="text-align: left;" | | + | |+ style="text-align: left;" | Literature values |
|- | |- | ||
! Value | ! Value | ||
| Line 81: | Line 124: | ||
! Species | ! Species | ||
! Notes | ! Notes | ||
| + | ! Weight | ||
! Reference | ! Reference | ||
|- | |- | ||
| Line 90: | Line 134: | ||
pH: 7.5 | pH: 7.5 | ||
Temperature: 37 °C | Temperature: 37 °C | ||
| + | |1024 | ||
|<ref name="Kim2014"> [http://www.nature.com/nature/journal/v509/n7502/pdf/nature13302.pdf M. Kim ''A draft map of the human proteome'' Nature, 2014 509, 575–581]</ref> | |<ref name="Kim2014"> [http://www.nature.com/nature/journal/v509/n7502/pdf/nature13302.pdf M. Kim ''A draft map of the human proteome'' Nature, 2014 509, 575–581]</ref> | ||
|- | |- | ||
| Line 99: | Line 144: | ||
pH: 7.5 | pH: 7.5 | ||
Temperature: 37 °C | Temperature: 37 °C | ||
| + | |1024 | ||
|<ref name="Wilhelm2014"> [http://www.nature.com/nature/journal/v509/n7502/pdf/nature13319.pdf M. Wilhelm ''Mass-spectrometry-based draft of the human proteome'' Nature, 2014 509, 582–587]</ref> | |<ref name="Wilhelm2014"> [http://www.nature.com/nature/journal/v509/n7502/pdf/nature13319.pdf M. Wilhelm ''Mass-spectrometry-based draft of the human proteome'' Nature, 2014 509, 582–587]</ref> | ||
|- | |- | ||
| Line 108: | Line 154: | ||
pH: 7.5 | pH: 7.5 | ||
Temperature: 37 °C | Temperature: 37 °C | ||
| + | |1024 | ||
|<ref name="Wilhelm2014"> [http://www.nature.com/nature/journal/v509/n7502/pdf/nature13319.pdf M. Wilhelm ''Mass-spectrometry-based draft of the human proteome'' Nature, 2014 509, 582–587]</ref> | |<ref name="Wilhelm2014"> [http://www.nature.com/nature/journal/v509/n7502/pdf/nature13319.pdf M. Wilhelm ''Mass-spectrometry-based draft of the human proteome'' Nature, 2014 509, 582–587]</ref> | ||
|- | |- | ||
|} | |} | ||
| + | |||
| + | {| class="wikitable" | ||
| + | |+ style="text-align: left;" | Description of the 5-LOX concentration distribution | ||
| + | ! Mode (ppm) !! Mode (mM) !! Confidence Interval !! Location parameter (µ) !! Scale parameter (σ) | ||
| + | |- | ||
| + | | 4.96E+01 || 2.74E-04|| 1.60E+00 || 4.09E+00 || 4.28E-01 | ||
| + | |} | ||
| + | |||
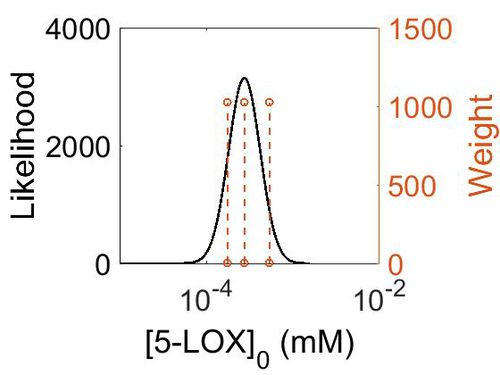
| + | [[Image:158.jpg|none|thumb|500px|The estimated probability distribution for 5-LOX concentration. The value and weight of the literature values used to define the distribution are indicated by an orange dashed line. The x axis is plotted on a log-scale. ]] | ||
| + | |||
| + | === K<sub>eq</sub> === | ||
| + | |||
| + | {|class="wikitable sortable" | ||
| + | |+ style="text-align: left;" | Literature values | ||
| + | |- | ||
| + | ! Gibbs Free Energy Change | ||
| + | ! Units | ||
| + | ! Species | ||
| + | ! Notes | ||
| + | ! Weight | ||
| + | ! Reference | ||
| + | |- | ||
| + | |(-15.9) - 18.01 | ||
| + | |kcal/mol | ||
| + | |Soybean | ||
| + | |Expression Vector: Soybean | ||
| + | Enzyme: Lipoxygenase-1 | ||
| + | pH:Not stated | ||
| + | Temperature: Not stated | ||
| + | |8 | ||
| + | |<ref name="Tejero2004”>[http://pubs.acs.org/doi/pdf/10.1021/jp040114n Tejero I., “Hydrogen Abstraction by Soybean Lipoxygenase-1. Density Functional Theory Study on | ||
| + | Active Site Models in Terms of Gibbs Free Energies” J. Phys. Chem. B, 2004, 108 (36), pp 13831–13838]</ref> | ||
| + | |- | ||
| + | |(-69.979996) | ||
| + | |kcal/mol | ||
| + | |Not stated | ||
| + | |Estimated | ||
| + | Enzyme: 5-Lipoxygenase | ||
| + | Substrate: Arachidonate | ||
| + | Product: 5-HPETE | ||
| + | pH: 7.3 | ||
| + | ionic strength: 0.25 | ||
| + | |64 | ||
| + | |<ref name="MetaCyc”>[http://metacyc.org/META/NEW-IMAGE?type=REACTION&object=ARACHIDONATE-5-LIPOXYGENASE-RXN Caspi et al 2014, "The MetaCyc database of metabolic pathways and enzymes and the BioCyc collection of Pathway/Genome Databases," Nucleic Acids Research 42:D459-D471]</ref> | ||
| + | |} | ||
| + | |||
| + | {| class="wikitable" | ||
| + | |+ style="text-align: left;" | Description of the 5-LOX Keq distribution | ||
| + | ! Mode !! Confidence Interval !! Location parameter (µ) !! Scale parameter (σ) | ||
| + | |- | ||
| + | | 2.27E+51 || 1.00E+01 || 1.19E+02 || 8.90E-01 | ||
| + | |} | ||
| + | |||
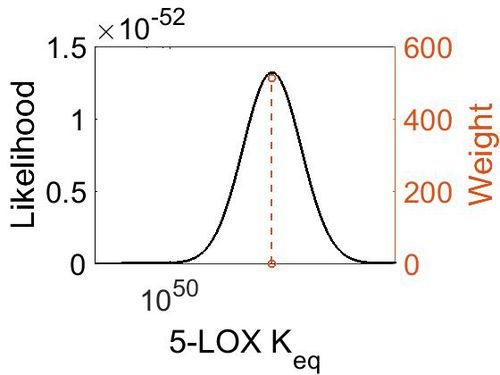
| + | [[Image:36.jpg|none|thumb|500px|The estimated probability distribution for 5-LOX Keq. The value and weight of the literature values used to define the distribution are indicated by an orange dashed line. The x axis is plotted on a log-scale. ]] | ||
== References == | == References == | ||
Latest revision as of 09:17, 21 August 2019
ALOX5 encodes the protein 5-LOX, which is responsible for the generation of 5-HPETE. The formation of the unstable hydroperoxy fatty acids (HPETE) begins with the abstraction of a hydrogen radical at the allylic position between two double bonds. The structure undergoes a rearrangement reaction which results in the formation of a conjugated diene system. The insertion of molecular oxygen and a hydrogen leads to the formation of the final structure, a hydroperoxy fatty acid.
Contents
Reaction
Chemical equation

Rate equation
Parameters
Kms
| Value | Units | Species | Notes | Weight | Reference |
|---|---|---|---|---|---|
| 5.10E-03 | 
|
Human | Expression Vector: Baculovirus, Sf9 insect cells
Enzyme: Recombinant 5-Lipoxygenase pH: 5.6 Temperature:37 |
256 | [1] |
| 1.20E-02 | 
|
Human | Expression Vector: Polymorphonuclear Leukocytes
Enzyme: 5-Lipoxygenase pH:7.5 Temperature: 22 |
512 | [2] |
| 6.31E-02 | 
|
Human | Expression Vector: Polymorphonuclear Leukocytes
Enzyme: 5-Lipoxygenase pH:7.5 Temperature: 22 |
512 | [3] |
| Mode (mM) | Confidence Interval | Location parameter (µ) | Scale parameter (σ) |
|---|---|---|---|
| 1.27E-02 | 2.74E+00 | -3.76E+00 | 7.73E-01 |
Kmp
| Mode (mM) | Location parameter (µ) | Scale parameter (σ) |
|---|---|---|
| 1.25E-02 | -3.63E+00 | 8.68E-01 |
kcat
| Value | Units | Species | Notes | Weight | Reference |
|---|---|---|---|---|---|
| 1500 + 75 | per minute | Potato | Expression Vector:Potato Tubers
Enzyme: 5-Lipoxygenase pH:5.5 Temperature: 23 |
16 | [4] |
| Mode (min-1) | Confidence Interval | Location parameter (µ) | Scale parameter (σ) |
|---|---|---|---|
| 1.50E+03 | 1.05E+00 | 7.31E+00 | 4.99E-02 |
Enzyme concentration
To convert the enzyme concentration from ppm to mM, the following equation was used.
| Value | Units | Species | Notes | Weight | Reference |
|---|---|---|---|---|---|
| 97.3 | 
|
Human | Expression Vector: Lung
Enzyme: 5-LOX pH: 7.5 Temperature: 37 °C |
1024 | [5] |
| 49.8 | 
|
Human | Expression Vector: Esophagus
Enzyme: 5-LOX pH: 7.5 Temperature: 37 °C |
1024 | [6] |
| 31.9 | 
|
Human | Expression Vector: Oral Cavity
Enzyme: 5-LOX pH: 7.5 Temperature: 37 °C |
1024 | [6] |
| Mode (ppm) | Mode (mM) | Confidence Interval | Location parameter (µ) | Scale parameter (σ) |
|---|---|---|---|---|
| 4.96E+01 | 2.74E-04 | 1.60E+00 | 4.09E+00 | 4.28E-01 |
Keq
| Gibbs Free Energy Change | Units | Species | Notes | Weight | Reference |
|---|---|---|---|---|---|
| (-15.9) - 18.01 | kcal/mol | Soybean | Expression Vector: Soybean
Enzyme: Lipoxygenase-1 pH:Not stated Temperature: Not stated |
8 | [7] |
| (-69.979996) | kcal/mol | Not stated | Estimated
Enzyme: 5-Lipoxygenase Substrate: Arachidonate Product: 5-HPETE pH: 7.3 ionic strength: 0.25 |
64 | [8] |
| Mode | Confidence Interval | Location parameter (µ) | Scale parameter (σ) |
|---|---|---|---|
| 2.27E+51 | 1.00E+01 | 1.19E+02 | 8.90E-01 |
References
- ↑ Shirumalla R. K. “RBx 7,796: A novel inhibitor of 5-lipoxygenase.” Inflamm Res. 2006 Dec ; 55 (12) : 517-27.
- ↑ Soberman R. J. "5- and 15(omega-6)-lipoxygenases from human polymorphonuclear leukocytes. Methods Enzymol. 1988; 163:344-9.
- ↑ Soberman R. J. “Characterization and separation of the arachidonic acid 5-lipoxygenase and linoleic acid omega-6 lipoxygenase (arachidonic acid 15-lipoxygenase) of human polymorphonuclear leukocytes.” J Biol Chem. 1985 Apr 10;260(7):4508-15.
- ↑ Mulliez E., “5-Lipoxygenase from potato tubers. Improved purification and physicochemical characteristics” Biochimica et Biophysica Acta, 1987;916(1):13-23.
- ↑ M. Kim A draft map of the human proteome Nature, 2014 509, 575–581
- ↑ 6.0 6.1 M. Wilhelm Mass-spectrometry-based draft of the human proteome Nature, 2014 509, 582–587
- ↑ [http://pubs.acs.org/doi/pdf/10.1021/jp040114n Tejero I., “Hydrogen Abstraction by Soybean Lipoxygenase-1. Density Functional Theory Study on Active Site Models in Terms of Gibbs Free Energies” J. Phys. Chem. B, 2004, 108 (36), pp 13831–13838]
- ↑ Caspi et al 2014, "The MetaCyc database of metabolic pathways and enzymes and the BioCyc collection of Pathway/Genome Databases," Nucleic Acids Research 42:D459-D471

