Difference between revisions of "Transformation of AA to 15-HPETE"
| Line 70: | Line 70: | ||
| 1.02E-02 || 2.40E+00 || -4.42E+00 || 4.10E-01 | | 1.02E-02 || 2.40E+00 || -4.42E+00 || 4.10E-01 | ||
|- | |- | ||
| − | |||
|} | |} | ||
| + | |||
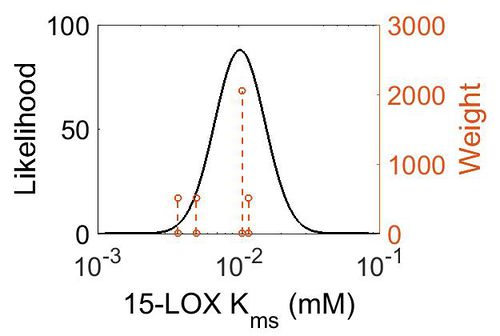
| + | [[Image:57.jpg|none|thumb|500px|The estimated probability distribution for 15-LOX Kms. The value and weight of the literature values used to define the distribution are indicated by an orange dashed line. The x axis is plotted on a log-scale. ]] | ||
| Line 81: | Line 82: | ||
| 1.02E-02 || -4.42E+00 || 4.11E-01 | | 1.02E-02 || -4.42E+00 || 4.11E-01 | ||
|} | |} | ||
| + | |||
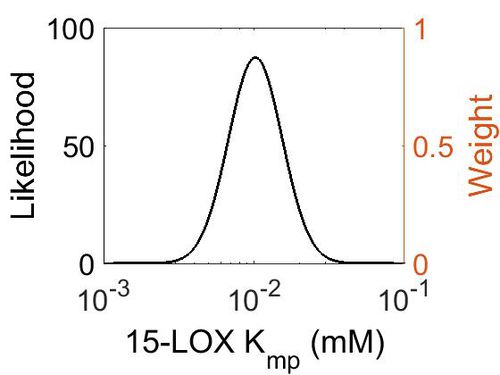
| + | [[Image:58.jpg|none|thumb|500px|The estimated probability distribution for 15-LOX Kmp. The value and weight of the literature values used to define the distribution are indicated by an orange dashed line. The x axis is plotted on a log-scale. ]] | ||
| + | |||
| Line 135: | Line 139: | ||
| 6.51E+01 || 4.62E+00 || 4.60E+00 || 6.50E-01 | | 6.51E+01 || 4.62E+00 || 4.60E+00 || 6.50E-01 | ||
|} | |} | ||
| + | |||
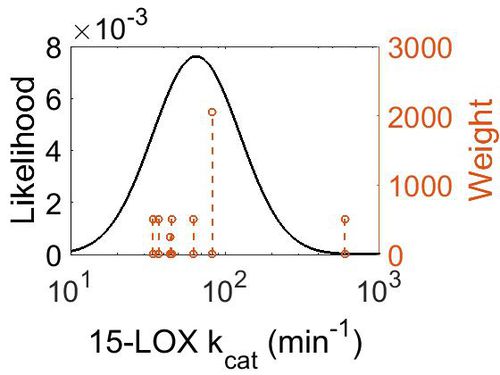
| + | [[Image:59.jpg|none|thumb|500px|The estimated probability distribution for 15-LOX kcat. The value and weight of the literature values used to define the distribution are indicated by an orange dashed line. The x axis is plotted on a log-scale. ]] | ||
===Enzyme concentration === | ===Enzyme concentration === | ||
| Line 181: | Line 187: | ||
| 4.98E-01 || 7.23E+00 || 7.12E-01 || 1.19E+00 | | 4.98E-01 || 7.23E+00 || 7.12E-01 || 1.19E+00 | ||
|} | |} | ||
| + | |||
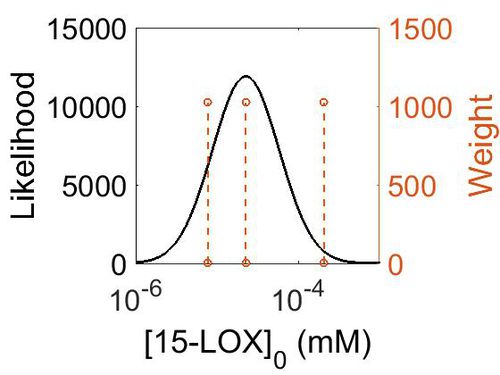
| + | [[Image:157.jpg|none|thumb|500px|The estimated probability distribution for 15-LOX concentration. The value and weight of the literature values used to define the distribution are indicated by an orange dashed line. The x axis is plotted on a log-scale. ]] | ||
===K<sub>eq</sub>=== | ===K<sub>eq</sub>=== | ||
| Line 211: | Line 219: | ||
|} | |} | ||
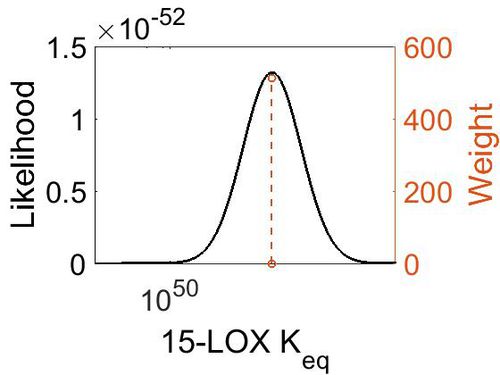
| + | [[Image:60.jpg|none|thumb|500px|The estimated probability distribution for 15-LOX Keq. The value and weight of the literature values used to define the distribution are indicated by an orange dashed line. The x axis is plotted on a log-scale. ]] | ||
== References == | == References == | ||
Revision as of 14:19, 15 May 2019
An isoform homologous to 12-LOX is the 15-LOX enzyme, which produces both 12 and 15-HETE products (Kuhn and O'Donnell 2006). An area of interest is that the 12 and 15 LOX products of the epidermis and the dermis have reciprocal activity during inflammation, for example 15-HETE reduces the infiltration of inflammatory cells, meanwhile 12-HETE acts as an activator for infiltrating immune cells (Dowd, Kobza Black et al. 1985, Serhan, Jain et al. 2003).
Contents
Reaction
Chemical equation

Rate equation
15-LOX Parameters
Kms
| Value | Units | Species | Notes | Reference |
|---|---|---|---|---|
| 3.70E-03 ± 3.00E-04 | 
|
Human | Expression Vector: Epithelium
Enzyme: 15-Lipoxygenase pH: 7.5 Temperature: 25 |
[1] |
| 5.00E-03 | 
|
Human | Expression Vector: Reticulocyte
Enzyme: 15-Lipoxygenase pH:7.5 Temperature: Unspecified |
[2] |
| 1.06E-02 | 
|
Human | Expression Vector: Keratinocyte
Enzyme: 15-Lipoxygenase pH: 6.7 - 7.3 Temperature: 37 |
[3] |
| 1.17E-02 ± 9.00E-04 | 
|
Human | Expression Vector: Baculovirus Insect Cell
Enzyme: Wildtype 15-Lipoxygenase pH: 6.8 Temperature: 37 |
[4] |
| Mode (mM) | Confidence Interval | Location parameter (µ) | Scale parameter (σ) |
|---|---|---|---|
| 1.02E-02 | 2.40E+00 | -4.42E+00 | 4.10E-01 |
Kmp
| Mode (mM) | Location parameter (µ) | Scale parameter (σ) |
|---|---|---|
| 1.02E-02 | -4.42E+00 | 4.11E-01 |
kcat
| Value | Units | Species | Notes | Reference |
|---|---|---|---|---|
| 595.8 ± 16.8 | 
|
Human | Expression Vector: Epithelium
Enzyme: 15-Lipoxygenase pH: 7.5 Temperature: 25 |
[1] |
| 37.2 ± 1.8 | per minute | Expression Vector:Human prostate epithelial
Enzyme:15-lipoxygenase-2 |
pH 7, Temperature: 22 | [5] |
| 45 ± 1.2 | pH 7.5, Temperature: 22 | |||
| 44.4 ± 2.4 | pH 8, Temperature: 22 | |||
| 34.2 ± 0.6 | 15°C, pH = 7.5 | |||
| 45 ± 1.2 | 22°C, pH = 7.5 | |||
| 62.4 ± 4.2 | 30°C, pH = 7.5 | |||
| 82.8 ± 4.8 | 37°C, pH = 7.5 |
| Mode (min-1) | Confidence Interval | Location parameter (µ) | Scale parameter (σ) |
|---|---|---|---|
| 6.51E+01 | 4.62E+00 | 4.60E+00 | 6.50E-01 |
Enzyme concentration
| Value | Units | Species | Notes | Reference |
|---|---|---|---|---|
| 4.09 | 
|
Human | Expression Vector: Lung
Enzyme: 15-LOX pH: 7.5 Temperature: 37 °C |
[6] |
| 37.4 | 
|
Human | Expression Vector: Spleen
Enzyme: 15-LOX pH: 7.5 Temperature: 37 °C |
[7] |
| 1.40 | 
|
Human | Expression Vector: Gut
Enzyme: 12-LOX pH: 7.5 Temperature: 37 °C |
[6] |
| Mode (mM) | Confidence Interval | Location parameter (µ) | Scale parameter (σ) |
|---|---|---|---|
| 4.98E-01 | 7.23E+00 | 7.12E-01 | 1.19E+00 |
Keq
| Gibbs Free Energy Change | Units | Species | Notes | Reference |
|---|---|---|---|---|
| (-69.979996) | kcal/mol | Not stated | Estimated
Enzyme: 15-LOX Substrate: Arachidonate Product: 15-HPETE pH: 7.3 ionic strength: 0.25 |
[8] |
| Mode | Confidence Interval | Location parameter (µ) | Scale parameter (σ) |
|---|---|---|---|
| 2.27E+51 | 1.00E+01 | 1.19E+02 | 8.90E-01 |
References
- ↑ 1.0 1.1 Jacquot C. "Isotope sensitive branching and kinetic isotope effects in the reaction of deuterated arachidonic acids with human 12- and 15-lipoxygenases. Biochemistry. 2008 Jul 8;47(27):7295-303. doi: 10.1021/bi800308q. Epub 2008 Jun 12.
- ↑ Jacquot C. "Synthesis of 11-Thialinoleic Acid and 14-Thialinoleic Acid, Inhibitors of Soybean and Human Lipoxygenases Org Biomol Chem. 2008 Nov 21; 6(22): 4242–4252.
- ↑ Burrall B. "Enzymatic properties of the 15-lipoxygenase of human cultured keratinocytes. J Invest Dermatol. 1988 Oct;91(4):294-7.
- ↑ Sloane D. L. "Conversion of human 15-lipoxygenase to an efficient 12-lipoxygenase: the side-chain geometry of amino acids 417 and 418 determine positional specificity. Protein Eng. 1995 Mar;8(3):275-82..
- ↑ Wecksler A. "Kinetic and Structural Investigations of the Allosteric Site in Human Epithelial 15-Lipoxygenase-2 Biochemistry, 2009, 48 (36), pp 8721–8730
- ↑ 6.0 6.1 M. Kim A draft map of the human proteome Nature, 2014 509, 575–581
- ↑ M. Wilhelm Mass-spectrometry-based draft of the human proteome Nature, 2014 509, 582–587
- ↑ Caspi et al 2014, "The MetaCyc database of metabolic pathways and enzymes and the BioCyc collection of Pathway/Genome Databases," Nucleic Acids Research 42:D459-D471


