Difference between revisions of "Transformation of 15-Keto-PGE2 to 13,14-Dihydro-15-Keto-PGE2"
(→Parameters) |
(→Enzyme concentration) |
||
| Line 130: | Line 130: | ||
===Enzyme concentration === | ===Enzyme concentration === | ||
{|class="wikitable" | {|class="wikitable" | ||
| − | |+ style="text-align: left;" | | + | |+ style="text-align: left;" | Literature values |
! Value | ! Value | ||
! Units | ! Units | ||
Revision as of 14:23, 16 May 2019
PTGR-2 catalyses the reduction of the conjugated α,β-unsaturated double bond of 15-Keto-PGE2. This reaction is NADPH-dependant and generates 13,14-dihydro-15-keto-PGE2.
Contents
Reaction
Chemical equation

Rate equation
Parameters
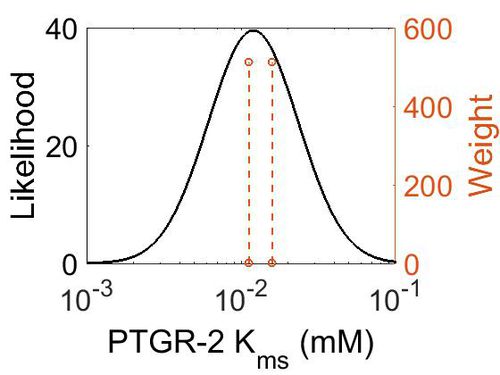
Kms
| Value | Units | Species | Notes | Reference |
|---|---|---|---|---|
| 0.01121 ± 0.00014 | mM | Human | Method: In vitro
Organism: Human Expression vector: E.coli Enzyme: PTGR2 pH: 7.5 Temperature: 37 ◦C Substrate: 15-Keto-PGE2 "For determining the KM and Vmax values for NADPH, 15-keto-PGE2 at a final concentration of 200 mM was used with different concentrations of NADPH (0–60 mM)." |
[1] |
| 0.01587 ± 0.00171 | mM | Human | Method: In vitro
Organism: Human Expression vector: E.coli Enzyme: e PTGR2 pH: 7.5 Temperature: 37 ◦C Substrate: NADPH "For determining the KM and Vmax values for NADPH, 15-keto-PGE2 at a final concentration of 200 mM was used with different concentrations of NADPH (0–60 mM)." |
[1] |
| 0.0496 ± 0.0058 | mM | Mouse | Method: In vitro
Organism: Mouse Expression vector: Enzyme: 13,14-dehydro-15-oxoprostaglandin 13-reductase pH: 7.4 Temperature: 37 ◦C Substrate: 15-Ketoprostaglandin E2 |
[1] |
| Mode (mM) | Confidence Interval | Location parameter (µ) | Scale parameter (σ) |
|---|---|---|---|
| 1.20E-02 | 4.92E+00 | -3.97E+00 | 6.71E-01 |
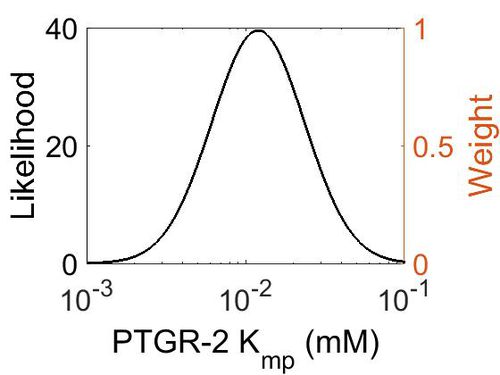
Kmp
| Mode (mM) | Location parameter (µ) | Scale parameter (σ) |
|---|---|---|
| 1.19E-02 | -3.97E+00 | 6.81E-01 |
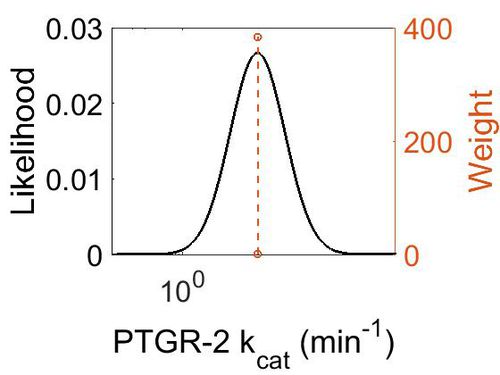
kcat
Note: Turnover values from EC 1.3.1.48 - 13,14-dehydro-15-oxoprostaglandin 13-reductase
| Value | Units | Species | Notes | Reference |
|---|---|---|---|---|
| 11.4 ± 0.9 | min-1 | Mouse | Method: In vitro
Organism: Mouse Expression vector: Enzyme: 13,14-dehydro-15-oxoprostaglandin 13-reductase pH: 7.4 Temperature: 37 ◦C Substrate: 15-Ketoprostaglandin E2 |
[1] |
| Mode (min-1) | Confidence Interval | Location parameter (µ) | Scale parameter (σ) |
|---|---|---|---|
| 1.14E+01 | 9.86E+00 | 3.22E+00 | 8.87E-01 |
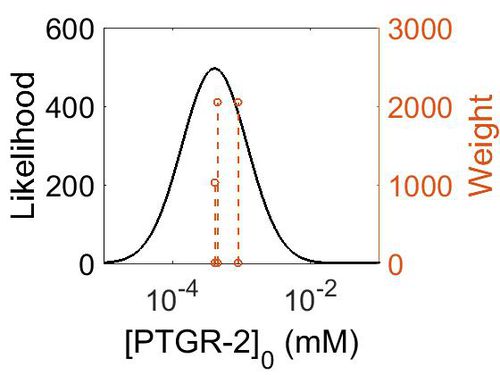
Enzyme concentration
| Value | Units | Species | Notes | Reference |
|---|---|---|---|---|
| 162 | ppm | Human | Expression Vector: Skin
Enzyme: PTGR2 pH: 7.5 Temperature: 37 °C |
[2] |
| 80.9 | ppm | Human | Expression Vector: Skin
Enzyme: PTGR2 pH: Unknown Temperature: Unknown |
Unknown |
| 74.1 | ppm | Human | Expression Vector: Oral Cavity
Enzyme: PTGR2 pH: 7.5 Temperature: 37 °C |
[2] |
| Mode (mM) | Confidence Interval | Location parameter (µ) | Scale parameter (σ) |
|---|---|---|---|
| 8.65E+01 | 1.45E+00 | 4.58E+00 | 3.47E-01 |
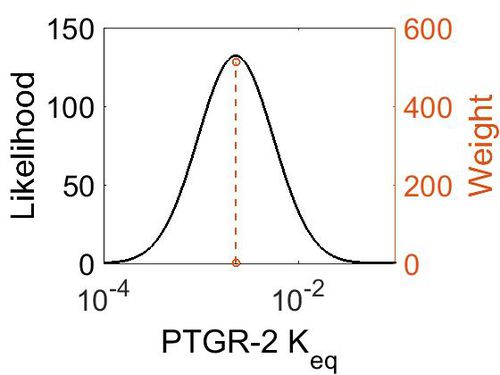
Keq
| Gibbs Free energy | Units | Species | Notes | Reference |
|---|---|---|---|---|
| 3.6006165 | kcal/mol | Unspecified | Calculations with a Gaussian98 suite of programs
Enzyme: COX (Unspecific) Substrate: Arachidonate Temperature: 298.15 K Pressure: 1 bar |
[3] |
| Mode | Confidence Interval | Location parameter (µ) | Scale parameter (σ) |
|---|---|---|---|
| 2.28E-03 | 1.00E+01 | -5.29E+00 | 8.91E-01 |
Misch
| Value | Units | Species | Notes | Reference |
|---|---|---|---|---|
| 9.9 +/-0.2 | minutes | Dog | In vivo
Temperature:37 pH:7 |
[4] |
| Value | Units | Species | Notes | Reference |
|---|---|---|---|---|
| 159.23 ± 0.71 | nmol min-1 mg-1 | Human | Method: In vitro
Organism: Human Expression vector: E.coli Enzyme: PTGR2 pH: 7.5 Temperature: 37 ◦C Substrate: 15-Keto-PGE2 |
[1] |
| 66.73 ± 1.36 | nmol min-1 mg-1 | Human | Method: In vitro
Organism: Human Expression vector: E.coli Enzyme: PTGR2 pH: 7.5 Temperature: 37 ◦C Substrate: NADPH |
[1] |
References
- ↑ 1.0 1.1 1.2 1.3 1.4 1.5 Structural basis for catalytic and inhibitory mechanisms of human prostaglandin reductase PTGR2, Structure. 2008 Nov 12;16(11):1714-23. doi: 10.1016/j.str.2008.09.007. Cite error: Invalid
<ref>tag; name "Wu2008" defined multiple times with different content Cite error: Invalid<ref>tag; name "Wu2008" defined multiple times with different content Cite error: Invalid<ref>tag; name "Wu2008" defined multiple times with different content Cite error: Invalid<ref>tag; name "Wu2008" defined multiple times with different content - ↑ 2.0 2.1 [http://www.nature.com/nature/journal/v509/n7502/pdf/nature13319.pdf M. Wilhelm Mass-spectrometry-based draft of the human proteome Nature, 2014 509, 582–587]
- ↑ P. Silva, "A theoretical study of radical-only and combined radical/carbocationic mechanisms of arachidonic acid cyclooxygenation by prostaglandin H synthase" Theor Chem Acc (2003) 110: 345
- ↑ W. Bothwell, "A radioimmunoassay for the unstable pulmonary metabolites of prostaglandin E1 and E2: an indirect index of their in vivo disposition and pharmacokinetics" Journal of Pharmacology and Experimental Therapeutics February 1982, 220 (2) 229-235

