Difference between revisions of "Simulating DBR Biotransformation"
Aliah.hawari (talk | contribs) |
Aliah.hawari (talk | contribs) (→Average Product Ratio) |
||
| Line 46: | Line 46: | ||
[[File: 09_DBR_biotrans_01.png |left| thumb| '''Figure 2''': Probability distribution of average product ratio values| 500px]] | [[File: 09_DBR_biotrans_01.png |left| thumb| '''Figure 2''': Probability distribution of average product ratio values| 500px]] | ||
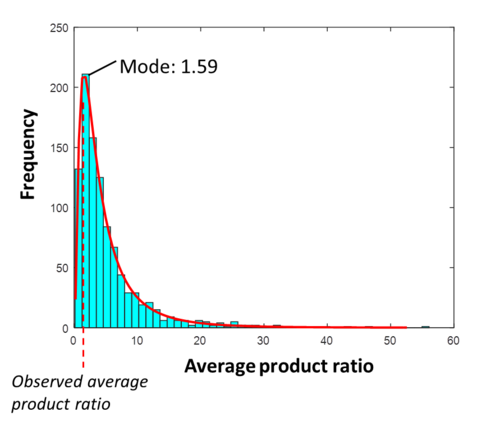
| − | Yield ratio of menthone:isomenthone were reported in Toogood, ''et. al.''(2015) <ref name="Toogood2015"></ref> (40:33), Solodar (1976) <ref name="Solodar1976"> [http://pubs.acs.org/doi/pdf/10.1021/jo00883a031 Solodar,J. 1976. '''Stereoselective reduction of menthone and isomenthone by dissolving alkali metals and by hydrogen with group 8 metals on carbon'''], J. Org. Chem. '''41'''(21):3461-3464</ref> (70:30) and Ringer, ''et. al.'' (2003) <ref name="Ringer2003">[http://www.ncbi.nlm.nih.gov/pubmed/13679086 Ringer, K.L. ''et. al.''. 2003.'''Monoterpene double-bond reductases of the (-)-menthol biosynthetic pathway:isolation and characterization of cDNAs encoding (-)-isopiperitenone reductase and (+)-pulegone reductase of peppermint], Arc. Biochem. Biophysics, '''418''':80-92</ref> (55:45). | + | Yield ratio of menthone:isomenthone were reported in Toogood, ''et. al.''(2015) <ref name="Toogood2015"></ref> (40:33), Solodar (1976) <ref name="Solodar1976"> [http://pubs.acs.org/doi/pdf/10.1021/jo00883a031 Solodar,J. 1976. '''Stereoselective reduction of menthone and isomenthone by dissolving alkali metals and by hydrogen with group 8 metals on carbon'''], J. Org. Chem. '''41'''(21):3461-3464</ref> (70:30) and Ringer, ''et. al.'' (2003) <ref name="Ringer2003">[http://www.ncbi.nlm.nih.gov/pubmed/13679086 Ringer, K.L. ''et. al.''. 2003.'''Monoterpene double-bond reductases of the (-)-menthol biosynthetic pathway:isolation and characterization of cDNAs encoding (-)-isopiperitenone reductase and (+)-pulegone reductase of peppermint], Arc. Biochem. Biophysics, '''418''':80-92</ref> (55:45). The global average product ratio of these values were taken as the mode and a CI factor of 10 was used to generate probability distribution. This probability distribution is used to sample random average product ratio during ensemble modelling. |
| + | |||
| + | Figure 2 shows the probability distribution of 1000 sample values for the average product ratio of DBR. The mode was determined to be 1.59 and the sample values are within the range of 0 to 100. Average product ratio between 0.16 to 15.9 falls within the 95% of confidence interval. The average product ratio observed from Toogood, ''et. al.'' (2015) <ref name="Toogood2015"></ref> is 1.2 for yield of 40% : 33% of menthone:isomenthone respectively. | ||
[[File: 10_DBR_biotrans_02.png |left| thumb| '''Figure 3''': Kernel density plot of average product ratio sampled| 500px]] | [[File: 10_DBR_biotrans_02.png |left| thumb| '''Figure 3''': Kernel density plot of average product ratio sampled| 500px]] | ||
| − | |||
| − | |||
| − | |||
| − | |||
| − | |||
| − | |||
| − | |||
| − | |||
| − | |||
| − | |||
| − | |||
| − | |||
| − | |||
| − | |||
| − | |||
| − | |||
| − | |||
| − | |||
| − | |||
| − | |||
| − | |||
| − | |||
| − | |||
| − | |||
| − | |||
| − | |||
| − | |||
| − | |||
| − | |||
| − | |||
| − | |||
| − | |||
| − | |||
| − | |||
| − | |||
| − | |||
| − | |||
| − | |||
| − | |||
| − | |||
| − | |||
| − | |||
| − | |||
| − | |||
| − | |||
| − | |||
| − | |||
| − | |||
| − | |||
| − | |||
| − | |||
| − | |||
| − | |||
| − | |||
| − | |||
| − | |||
| − | |||
| − | |||
| − | |||
| − | |||
| − | |||
| − | |||
| − | |||
| − | |||
| − | |||
| − | |||
==References == | ==References == | ||
<references/> | <references/> | ||
Revision as of 14:28, 15 August 2016
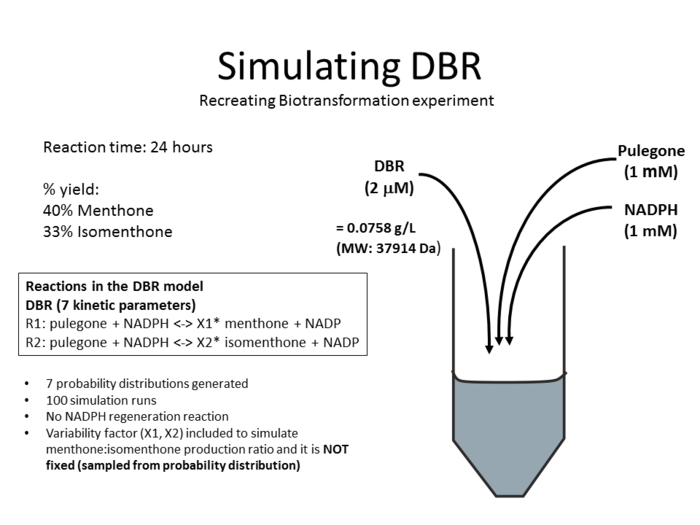
SUMMARY This DBR simulation is of the biotransformation experiment as described in Toogood, et. al. (2015) [1]. The experiment observed a percentage yield of 40% and 33% of menthone and isomenthone respectively after 24 hours. An overview of the simulation including the concentration of enzyme, substrate and cofactor is shown in Figure 1. Ensemble modelling of this reaction was carried out for 200 samples where the kinetic parameters were sampled randomly from 7 probability distributions. To describe the production variability of menthone to isomenthone, a variability factor (X1 and X2) were included in the reaction equation. These variabililty factors were calculated from the average product ratio sampled from a probability distribution.
Average Product Ratio
Yield ratio of menthone:isomenthone were reported in Toogood, et. al.(2015) [1] (40:33), Solodar (1976) [2] (70:30) and Ringer, et. al. (2003) [3] (55:45). The global average product ratio of these values were taken as the mode and a CI factor of 10 was used to generate probability distribution. This probability distribution is used to sample random average product ratio during ensemble modelling.
Figure 2 shows the probability distribution of 1000 sample values for the average product ratio of DBR. The mode was determined to be 1.59 and the sample values are within the range of 0 to 100. Average product ratio between 0.16 to 15.9 falls within the 95% of confidence interval. The average product ratio observed from Toogood, et. al. (2015) [1] is 1.2 for yield of 40% : 33% of menthone:isomenthone respectively.
References
- ↑ 1.0 1.1 1.2 Toogood, H.S. et. al.2015.Enzymatic menthol production: One-pot approach using engineered Escherichia coli , ACS Synthetic Biology, 4:1112-1123.
- ↑ Solodar,J. 1976. Stereoselective reduction of menthone and isomenthone by dissolving alkali metals and by hydrogen with group 8 metals on carbon, J. Org. Chem. 41(21):3461-3464
- ↑ Ringer, K.L. et. al.. 2003.Monoterpene double-bond reductases of the (-)-menthol biosynthetic pathway:isolation and characterization of cDNAs encoding (-)-isopiperitenone reductase and (+)-pulegone reductase of peppermint, Arc. Biochem. Biophysics, 418:80-92


