Difference between revisions of "Dephosphorylation"
m |
|||
| Line 116: | Line 116: | ||
File:L 3.1.3.48 protein-tyrosine-phosphatase vmax 5.png|3.1.3.48 protein-tyrosine-phosphatase vmax5 | File:L 3.1.3.48 protein-tyrosine-phosphatase vmax 5.png|3.1.3.48 protein-tyrosine-phosphatase vmax5 | ||
</gallery> | </gallery> | ||
| + | |||
| + | <h2>Km<sub>P</sub> value and equilibrium constant </h2> | ||
| + | The K<sub>m</sub> value for the product is assumed to be similar to but slightly smaller than the the K<sub>m</sub> value of the substrate because of the similarity of the both species. Therefore the K<sub>m</sub> value of the substrate is multiplied by 0.95 to gain the one of the product and the uncertainty is increased by increasing the error on Km<sub>substrate</sub> b< 50%. | ||
| + | |||
| + | For information about the equilibrium constant please see [[Equilibrium_constants|here]]. | ||
Revision as of 11:44, 31 March 2014
Binding Reaction

Kinetic equation
General Information
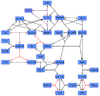
The most enzymes in the MAP-Kinase signaling pathway are activated by phosphorylation. The inactivation is therefore due to a dephosphorylation step. The amino acids that are phosphorylated are tyrosine, serine, threonine, so the three main dephosphatases address phosphate residues at these side chains. In BRENDA there are several values measured, for the Km and vmax value. In contrast to the reactions in which the enyzme that catalyses the reaction appears also as substrate in the model the concentration of the dephosphatases is assumed to be constant and therefore the vmax value instead or the kcat value is used. Because of the reason that it is not clear which dephoshpatase is mainly responsible for the inactivation an average of all measured dephosphatase values is used in our model.
final Parameter

Parameter
| Notes | Data | |||||||||||||||||||||||||||||||||
|---|---|---|---|---|---|---|---|---|---|---|---|---|---|---|---|---|---|---|---|---|---|---|---|---|---|---|---|---|---|---|---|---|---|---|
| There are three main deophosphatases, phosphoserine phosphatase (EC 3.1.3.3), phosphoprotein phosphatase (EC 3.1.3.16), protein-tyrosine phosphatase (3.1.3.48). The data available in BRENDA is used to calculate the average and standard deviation. |
|
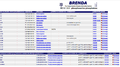
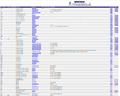
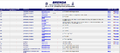
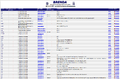
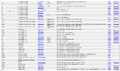
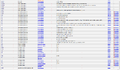
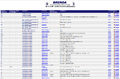
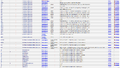
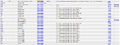
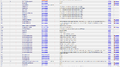
Screenshots of the BRENDA database
3.1.3.3-phosphoserine phosphatase
3.1.3.3-phosphoserine phosphatase

3.1.3.16-phosphoprotein phosphatase
3.1.3.16-phosphoprotein phosphatase Km
3.1.3.16-phosphoprotein phosphatase vmax


3.1.3.48 protein-tyrosine-phosphatase
Km
3.1.3.48 protein-tyrosine-phosphatase Km1
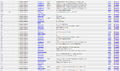
3.1.3.48 protein-tyrosine-phosphatase Km2
3.1.3.48 protein-tyrosine-phosphatase Km3
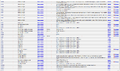
3.1.3.48 protein-tyrosine-phosphatase Km4
3.1.3.48 protein-tyrosine-phosphatase Km5


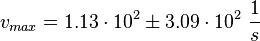
vmax
3.1.3.48 protein-tyrosine-phosphatase vmax1
3.1.3.48 protein-tyrosine-phosphatase vmax2
3.1.3.48 protein-tyrosine-phosphatase vmax3
3.1.3.48 protein-tyrosine-phosphatase vmax4
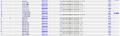
3.1.3.48 protein-tyrosine-phosphatase vmax5


KmP value and equilibrium constant
The Km value for the product is assumed to be similar to but slightly smaller than the the Km value of the substrate because of the similarity of the both species. Therefore the Km value of the substrate is multiplied by 0.95 to gain the one of the product and the uncertainty is increased by increasing the error on Kmsubstrate b< 50%.
For information about the equilibrium constant please see here.