Difference between revisions of "Degradation of R"
(→Parameters) |
(→Parameters) |
||
| Line 15: | Line 15: | ||
== Parameters == | == Parameters == | ||
| − | The parameter of this reaction is the degradation rate of R (<math>d_{R}</math>). | + | The parameter of this reaction is the degradation rate of R (<math>d_{R}</math>). The parameter values were derived from proteomics studies on different proteins of S. coelicolor. |
{|class="wikitable" | {|class="wikitable" | ||
| Line 35: | Line 35: | ||
and <math>0.09-0.38 s^{-1}</math><ref name="Chatterjee2011"></ref>) | and <math>0.09-0.38 s^{-1}</math><ref name="Chatterjee2011"></ref>) | ||
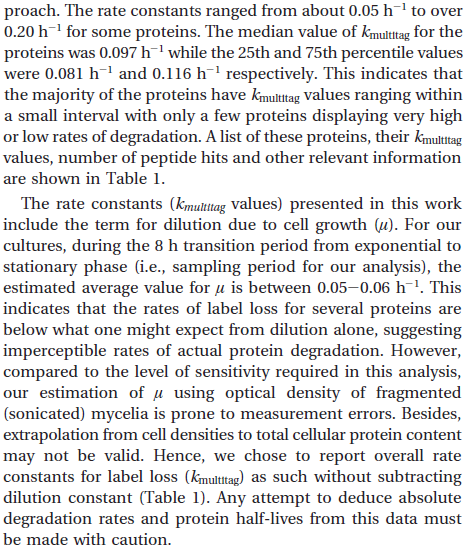
| − | | In a study on | + | |In a quantitative proteomics study on protein turnover rates in dynamic systems, Jayapal et al. reported the degradation rates of 115 proteins in ''S. coelicolor'' cultures undergoing transition from exponential growth to stationary phase. The values were in the range <math>0.05-0.22 h^{-1} (8.3 \cdot 10^{-4}-0.0037 min^{-1}) </math> with a median of <math>0.097 h^{-1} (0.00162 min^{-1})</math>. |
| − | [[Image: | + | [[Image:DR-text.png|center|thumb|600px|Jayapal et al. 2012<ref name="Jayapal2010"></ref>]] |
| − | |||
| − | |||
| − | |||
| − | |||
| − | |||
| − | |||
| − | |||
| − | |||
| − | |||
| − | |||
| − | |||
| − | |||
| − | |||
| − | |||
| − | |||
|} | |} | ||
Revision as of 17:20, 16 October 2015
The ScbR monomer (R) degrades.
Contents
Chemical equation

Rate equation
![r= d_{R}\cdot[R]](/wiki/images/math/6/7/5/675d245d387b813d8bcaf71d7a91c6f9.png)
Parameters
The parameter of this reaction is the degradation rate of R ( ). The parameter values were derived from proteomics studies on different proteins of S. coelicolor.
| Name | Value | Units | Value in previous GBL models [1] [2] | Remarks-Reference |
|---|---|---|---|---|

|
 [3] [4] [3] [4]
|

|
 [1] [1]
(Range tested: (Bistability range: and |
In a quantitative proteomics study on protein turnover rates in dynamic systems, Jayapal et al. reported the degradation rates of 115 proteins in S. coelicolor cultures undergoing transition from exponential growth to stationary phase. The values were in the range  with a median of with a median of  . .
 Jayapal et al. 2012[4] |
Parameters with uncertainty
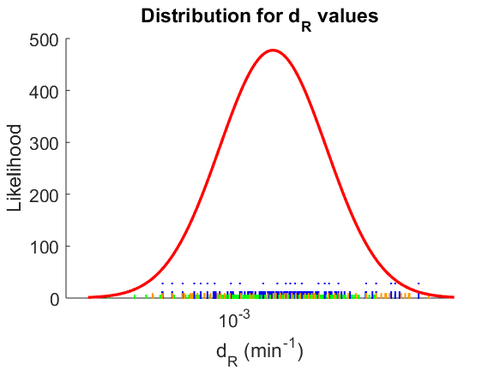
The most plausible parameter value for the  is decided to be
  and the confidence interval
  . This means that the mode of the PDF is 0.00118 and the range where 95% of the values are found is between
  and
and  .
.
The probability distribution for the parameter, adjusted accordingly in order to reflect the above values, is the following:
The location and scale parameters of the distribution are:
| Parameter | μ | σ |
|---|---|---|

|

|

|
References
- ↑ 1.0 1.1 1.2 S. Mehra, S. Charaniya, E. Takano, and W.-S. Hu. A bistable gene switch for antibiotic biosynthesis: The butyrolactone regulon in streptomyces coelicolor. PLoS ONE, 3(7), 2008.
- ↑ 2.0 2.1 2.2 A. Chatterjee, L. Drews, S. Mehra, E. Takano, Y.N. Kaznessis, and W.-S. Hu. Convergent transcription in the butyrolactone regulon in streptomyces coelicolor confers a bistable genetic switch for antibiotic biosynthesis. PLoS ONE, 6(7), 2011.
- ↑ Trötschel C, Albaum SP, Poetsch A. Proteome turnover in bacteria: current status for Corynebacterium glutamicum and related bacteria. Microbial biotechnology. 2013;6(6):708-719.
- ↑ 4.0 4.1 Jayapal KP, Sui S, Philp RJ, Kok YJ, Yap MG, Griffin TJ, Hu WS. Multitagging proteomic strategy to estimate protein turnover rates in dynamic systems. J Proteome Res. 2010 May 7;9(5):2087-97.


 )
)


