Difference between revisions of "Decay of PGI2 to exPGI2"
(→Decay Parameters) |
(→Decay Parameters) |
||
| Line 17: | Line 17: | ||
! style="text-align: center; font-weight: bold;" | Rate constant(min -1) | ! style="text-align: center; font-weight: bold;" | Rate constant(min -1) | ||
! style="text-align: center; font-weight: bold;" | Notes | ! style="text-align: center; font-weight: bold;" | Notes | ||
| + | ! style="text-align: center; font-weight: bold;" | Weight | ||
! style="text-align: center; font-weight: bold;" | Reference | ! style="text-align: center; font-weight: bold;" | Reference | ||
|- | |- | ||
| Line 24: | Line 25: | ||
| style="text-align: center;" | 0.231 | | style="text-align: center;" | 0.231 | ||
| style="text-align: center;" | | | style="text-align: center;" | | ||
| + | | style="text-align: center;" | 8 | ||
| style="text-align: center;" |<ref name="Cawello1994”>[https://www.ncbi.nlm.nih.gov/pubmed/8070511 Cawello W., "Metabolism and pharmacokinetics of prostaglandin E1 administered by intravenous infusion in human subjects." Eur J Clin Pharmacol. 1994;46(3):275-7.]</ref> | | style="text-align: center;" |<ref name="Cawello1994”>[https://www.ncbi.nlm.nih.gov/pubmed/8070511 Cawello W., "Metabolism and pharmacokinetics of prostaglandin E1 administered by intravenous infusion in human subjects." Eur J Clin Pharmacol. 1994;46(3):275-7.]</ref> | ||
|- | |- | ||
Latest revision as of 14:52, 22 May 2019
Return to Degradation Pathways
Rate equation
Decay Parameters
| Reaction # | Species | Half Life (min) | Rate constant(min -1) | Notes | Weight | Reference |
|---|---|---|---|---|---|---|
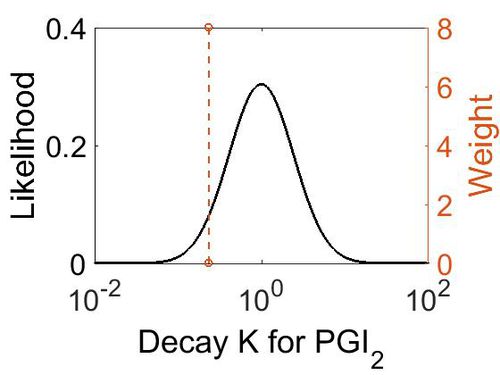
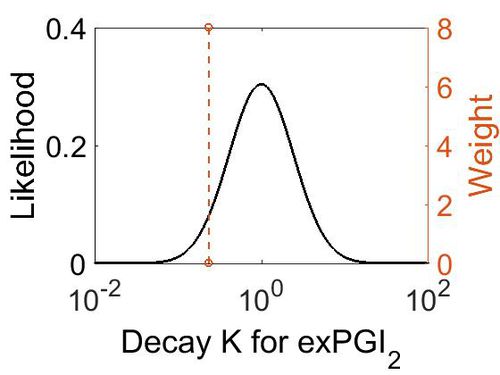
| 48 | exPGI2 | 3 | 0.231 | 8 | [1] |
| Mode (min-1) | Confidence Interval | Location parameter (µ) | Scale parameter (σ) |
|---|---|---|---|
| 2.30E-01 | 1.10E+00 | -1.46E+00 | 9.49E-02 |


