Return to overview
Return to Degradation Pathways
Rate equation
Decay Parameters
Literature values
| Reaction #
|
Species
|
Half Life (min)
|
Rate constant(min -1)
|
Notes
|
Weights
|
Reference
|
| 52
|
exPGD2
|
1.5 - 1.6
|
0.462 to 0.433
|
Human brain
|
8
|
[1]
|
Description of the PGD2 decay constant distribution
| Mode (min-1) |
Confidence Interval |
Location parameter (µ) |
Scale parameter (σ)
|
| 2.30E-02 |
1.10E+00 |
-3.76E+00 |
9.49E-02
|
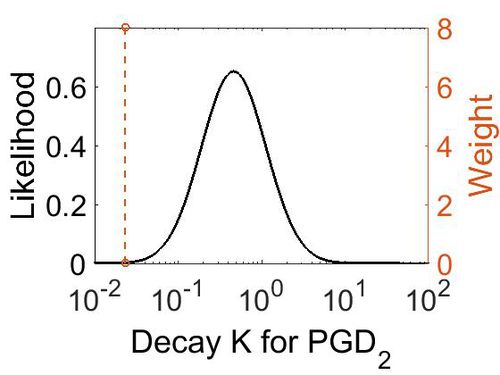
The estimated probability distribution for PGD2 decay constant. The value and weight of the literature values used to define the distribution are indicated by an orange dashed line. The x axis is plotted on a log-scale.
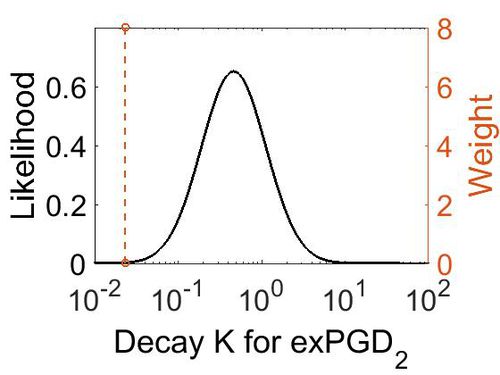
The estimated probability distribution for exPGD2 decay constant. The value and weight of the literature values used to define the distribution are indicated by an orange dashed line. The x axis is plotted on a log-scale.
References


