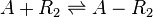
Binding of R2 to A
The ScbR homo-dimer (R2) forms a complex with ScbA (A).


Contents
Chemical equation
Rate equation
![r= \frac{k^{-}_{3}}{K_{d3}}\cdot [A]\cdot [R_{2}] - k^{-}_{3}\cdot [A-R_{2}]](/wiki/images/math/0/c/d/0cd085b3802a4baeb63922cb1279a5da.png)
Parameters
[NOTE TO MARC: I think the parameter values for the k3 are too arbitrary (see explanation below). Is there any way to choose more reliable ones?]
The parameters of this reaction are the dissociation constant for binding of ScbR to ScbA ( ) and the dissociation rate for binding of ScbR to ScbA (
 ). Since no evidence of the existence of the ScbA-ScbR complex has been found so far, our belief is that the interaction between the two proteins should be an unstable/ transient. The values of such complexes according to the literature [1] , lie in the millimolar or micromolar scale.

| Parameter | Value | Units | Origin | Remarks |
|---|---|---|---|---|
|
|
 [2] [2]
|

|
Comparison of strong vs weak protein-protein interactions | The range of values correspond to weak protein interactions.  interactions of different proteins were investigated [2] by calculating the interactions of different proteins were investigated [2] by calculating the  by using the Van't Hoff equation by using the Van't Hoff equation 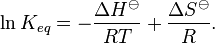
|
|
|
 [2] [3] [2] [3]
|

|
From various mechanisms of protein-protein interaction it was deduced that the  of the reaction should be less than of the reaction should be less than 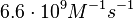 .[3] Therefore the range of is .[3] Therefore the range of is  . Therefore the range of the values is calculated as per . Therefore the range of the values is calculated as per 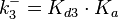 , where the value for is assumed to be the most plausible value within the reported range. , where the value for is assumed to be the most plausible value within the reported range.
|
Parameters with uncertainty
The probability distributions, adjusted accordingly in order to reflect the above values, are the following:
The most plausible parameter value for the is decided to be  and the confidence interval
  . This means that the mode of the PDF is
  and the range where 95% of the values are found is between
  and
and  nM.
nM.
In a similar way, the most plausible value for is 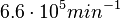 and the confidence interval 6. This means that the mode of the PDF is
  and the range where 95% of the values are found is between and
  .
.
The probability distributions for the two parameters, adjusted accordingly in order to reflect the above values, are the following:
The location and scale parameters of the distributions are:
| Parameter | μ | σ |
|---|---|---|
|
|

|

|
|
|

|

|
References
- ↑ 1.0 1.1 Saliha Ece Acuner Ozbabacan, Hatice Billur Engin, Attila Gursoy, and Ozlem Keskin. Transient protein–protein interactions. Protein Engineering, Design and Selection first published online June 15, 2011
- ↑ 2.0 2.1 2.2 Wesley E. Stites. Protein−Protein Interactions: Interface Structure, Binding Thermodynamics, and Mutational Analysis. Chemical Reviews 1997 97 (5), 1233-1250
- ↑ 3.0 3.1 Janin, Joel. The kinetics of protein-protein recognition. Proteins-Structure Function and Bioinformatics (1997): 153-161.