Difference between revisions of "Basic mevalonate pathway model with limonene synthesis: Construction and Ensemble analysis"
Aliah.hawari (talk | contribs) |
Aliah.hawari (talk | contribs) (→The simulation) |
||
| Line 17: | Line 17: | ||
To simulate the experiment above, the model was simulated for 72 hours and ''E. coli'' was grown until OD_{600}= 5. For each model generation (iteration) 5000 ensemble models were generated, which means for each iteration, 5000 values were sampled from each distribution to describe the ensemble models. The concentration for input metabolites such as Acetyl coA along with the reductants (NADP, NADPH) and energy metabolites (ATP, ADP) were made constant in the model. The values for these concentrations were based on measured absolute concentrations in ''E. coli'' from (ref1=Park2006). The enzyme concentration in this model is also fixed, with the concentration values based on measured intercellular concentrations from (ref2=Weaver 2015). In that study, intercellular concentrations of enzymes of the bottom mevalonate pathway with amorphadiene (A different type of terpene) synthesis were measured, and these genes were from pbMIS plasmid that uses a the pTrc promoter for all of its bottom mevalonate pathway genes. This differs that what is used in our experiment in two ways: 1) We study limonene synthesis instead of amorphadiene; and 2) Our experiment used pjBEI-6410 plasmid that used pLac promoter for the upstream pathway genes, pTrc promoter for the bottom mevalonate pathway genes including for limonene synthesis. Therefore, there is a high level of uncertainty for the concentrations used for the enzymes in the pathway, especially for LIMS and GPPS. | To simulate the experiment above, the model was simulated for 72 hours and ''E. coli'' was grown until OD_{600}= 5. For each model generation (iteration) 5000 ensemble models were generated, which means for each iteration, 5000 values were sampled from each distribution to describe the ensemble models. The concentration for input metabolites such as Acetyl coA along with the reductants (NADP, NADPH) and energy metabolites (ATP, ADP) were made constant in the model. The values for these concentrations were based on measured absolute concentrations in ''E. coli'' from (ref1=Park2006). The enzyme concentration in this model is also fixed, with the concentration values based on measured intercellular concentrations from (ref2=Weaver 2015). In that study, intercellular concentrations of enzymes of the bottom mevalonate pathway with amorphadiene (A different type of terpene) synthesis were measured, and these genes were from pbMIS plasmid that uses a the pTrc promoter for all of its bottom mevalonate pathway genes. This differs that what is used in our experiment in two ways: 1) We study limonene synthesis instead of amorphadiene; and 2) Our experiment used pjBEI-6410 plasmid that used pLac promoter for the upstream pathway genes, pTrc promoter for the bottom mevalonate pathway genes including for limonene synthesis. Therefore, there is a high level of uncertainty for the concentrations used for the enzymes in the pathway, especially for LIMS and GPPS. | ||
| + | |||
| + | [[File:MVA_v16_plasmids_OD.png|left|800px]] | ||
== Parameters == | == Parameters == | ||
Revision as of 14:11, 31 January 2018
This model serves as the preliminary MVA pathway framework that we have used as the foundation to debug and design improved MVA models. Although basic, this model was able to provide useful insights into the control of the MVA pathway and suggests strategies for possible engineering. The ensemble analysis carried out for this model have generated a total 8 model generations that have shown a significant improvement in their model scores after each reiteration. A step-by-step ensemble analysis that included scoring the models based on experimental data and identifying influential parameters have found that the proteins that are influential to the pathway are LIMS, MDC, GPPS and IDI. The analysis was also able to shed light on product inhibitions in the pathway that would influence the production of limonene, and also suggests an possible topological engineering design that could accelerate the pathway even more.
The simulation
Experiment
This simulation is based on an experiment on the DH10B strain of E. coli cell cultures that produces limonene that are sequestered into an organic layer. Brief description of the experimental method is as follows:
- -The DH10B strain of E. coli was transformed with the limonene production plasmid pJBEI6410.
- -Three 60 ml cultures (A, B and C), inoculated from individual colonies, were grown in flasks at 30 oC in a shaker incubator.
- -When cultures reached OD600 of 0.75 they were split into multiple 5 ml aliquots and 1 ml of dodecane overlay was added (timepoint zero). At this point some samples were Induced by the addition of IPTG (25 uM final concentration), other samples were left Uninduced. In addition controls were set-up with limonene added (500 ug/L) to one aliquot of each culture.
- -All cultures were then incubated at 30 oC in a shaker incubator until the designated timepoints.
- -At each timepoint (0, 2, 4, 8, 24 hr) samples were removed, OD600 was measured, the dodecane overlay was recovered for limonene quantification, and total RNA was prepared (but no RNAseq was performed on the 24hr samples as RNA quality was too low). The limonene control samples were analysed only at the 8 hr timepoint. The protein fraction of each sample was recovered and stored at -80oC.
- -The total RNA samples were treated to deplete ribosomal RNA (rRNA) and RNA integrity (RIN values) were determined for each sample prior to sending them for RNAseq
In silico simulation
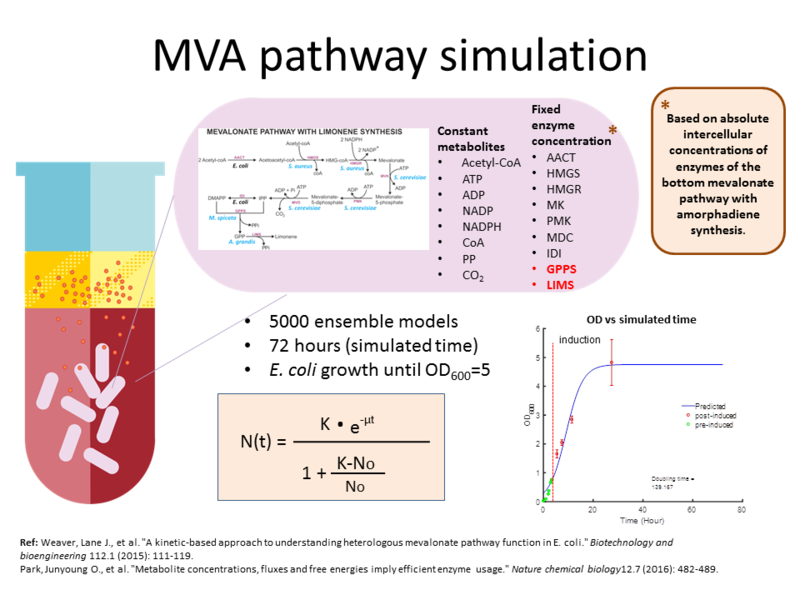
To simulate the experiment above, the model was simulated for 72 hours and E. coli was grown until OD_{600}= 5. For each model generation (iteration) 5000 ensemble models were generated, which means for each iteration, 5000 values were sampled from each distribution to describe the ensemble models. The concentration for input metabolites such as Acetyl coA along with the reductants (NADP, NADPH) and energy metabolites (ATP, ADP) were made constant in the model. The values for these concentrations were based on measured absolute concentrations in E. coli from (ref1=Park2006). The enzyme concentration in this model is also fixed, with the concentration values based on measured intercellular concentrations from (ref2=Weaver 2015). In that study, intercellular concentrations of enzymes of the bottom mevalonate pathway with amorphadiene (A different type of terpene) synthesis were measured, and these genes were from pbMIS plasmid that uses a the pTrc promoter for all of its bottom mevalonate pathway genes. This differs that what is used in our experiment in two ways: 1) We study limonene synthesis instead of amorphadiene; and 2) Our experiment used pjBEI-6410 plasmid that used pLac promoter for the upstream pathway genes, pTrc promoter for the bottom mevalonate pathway genes including for limonene synthesis. Therefore, there is a high level of uncertainty for the concentrations used for the enzymes in the pathway, especially for LIMS and GPPS.

Parameters
Acknowledgements
Special thanks to Dr. Christopher Robinson from the SynBioChem Centre University of Manchester for carrying out the experiment and supplying all of the OD readings and limonene titers for this simulation.