46BR.1N fibroblasts Fatty acid analysis Results
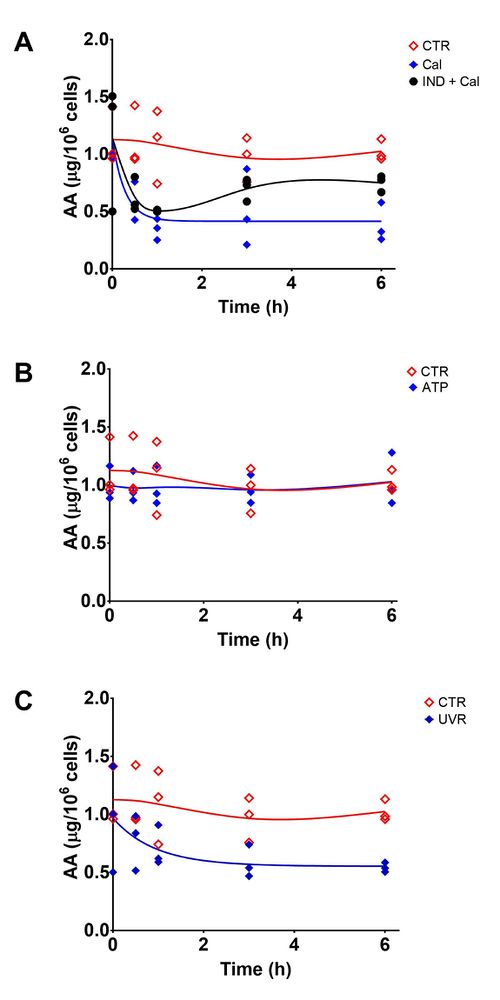
The aim of this study was to estimate the levels of AA in cells which were unstimulated and stimulated with A23187 (with/without COX inhibition), ATP and UVR. GC-FID was used for this fatty acid analysis and the values were normalized using cell numbers (ug/106 cells).
| Time (h) | Experiment | ||||
|---|---|---|---|---|---|
| Unstimulated | A23187 | Indomethacin + A23187 | UVR | ATP | |
| 0 | 1.13 ± 0.25 | 0.96 ± 0.00 | 0.64 ± 0.49 | 0.97 ± 0.46 | 1.00 ± 0.15 |
| 0.5 | 1.12 ± 0.27 | 0.44 ± 0.32 | 0.63 ± 0.15 | 0.78 ± 0.24 | 0.98 ± 0.13 |
| 1 | 1.09 ± 0.32 | 0.34 ± 0.13 | 0.84 ± 0.59 | 0.71 ± 0.18 | 0.98 ± 0.17 |
| 3 | 0.97 ± 0.19 | 0.51 ± 0.34 | 0.65 ± 0.13 | 0.58 ± 0.14 | 0.96 ± 0.12 |
| 6 | 1.03 ± 0.09 | 0.42 ± 0.23 | 0.79 ± 0.09 | 0.54 ± 0.04 | 1.03 ± 0.22 |

Levels of cellular arachidonic acid in 46BR.1N fibroblasts following stimulation with (A) A23187, (B) UVR and (C) ATP 6h post stimulation. Data points are from n=3 independent experiments. Non-linear lines of best fit are shown for untreated control cells (red), treated cells (blue) and treated with indomethacin and A23187 cells (black). Abbreviations: control cells (CTR), calcium ionophore (A23187, 5 µM) (CaI) and indomethacin (10 mM) (IND).