HaCaT Fatty acid analysis Results
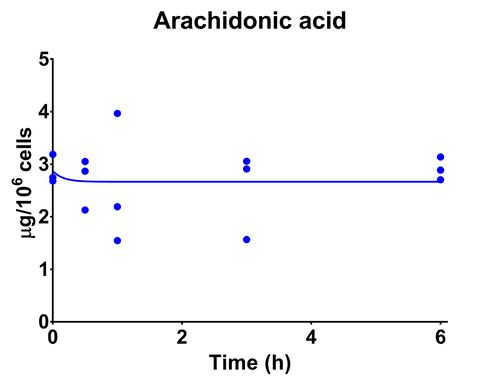
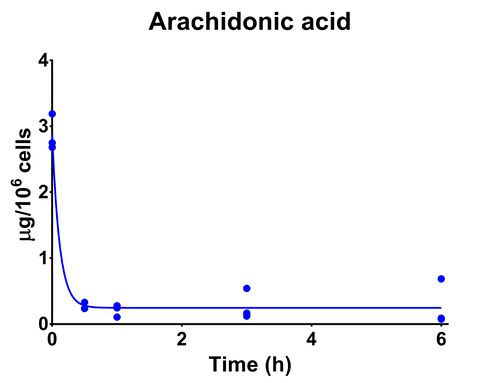
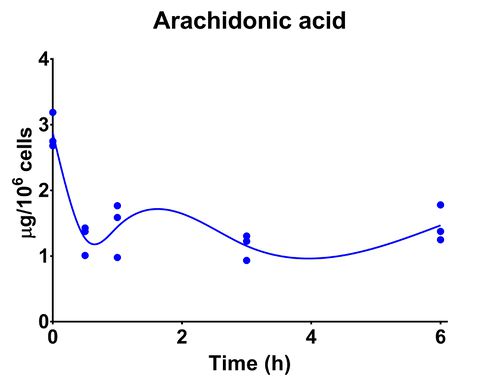
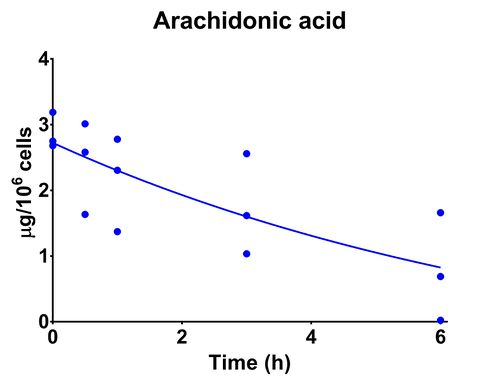
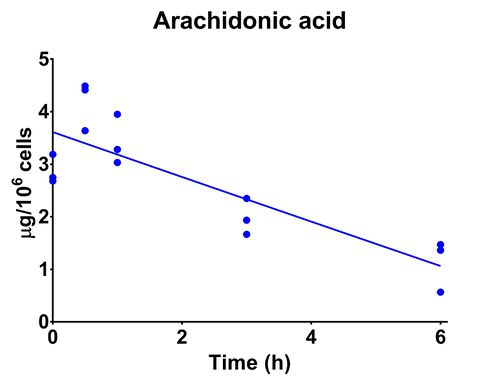
The aim of this study was to estimate the levels of AA in cells which were unstimulated and stimulated with A23187 (with/without COX inhibition), ATP and UVR. GC-FID was used for this fatty acid analysis and the values were normalized using cell numbers (ug /106 cells).
Contents
- 1 Summary Table
- 2 Estimation of cellular arachidonic acid in unstimulated cells
- 3 Estimation of cellular arachidonic acid following stimulation with calcium ionophore (A23187)
- 4 Estimation of cellular arachidonic acid following stimulation with ATP
- 5 Estimation of cellular arachidonic acid following stimulation with UVR
- 6 Estimation of cellular arachidonic acid following inhibition with indomethacin
Summary Table
| Time (h) | Experiment | ||||
|---|---|---|---|---|---|
| Unstimulated | A23187 | Indomethacin + A23187 | UVR | ATP | |
| 0 | 2.87 ± 0.28 | 2.87 ± 0.28 | 2.87 ± 0.28 | 2.87 ± 0.28 | 2.87 ± 0.28 |
| 0.5 | 2.68 ± 0.49 | 0.28 ± 0.07 | 4.18 ± 0.47 | 2.41 ± 0.70 | 1.27 ± 0.23 |
| 1 | 2.57 ± 1.25 | 0.21 ± 0.09 | 3.42 ± 0.47 | 2.15 ± 0.72 | 1.44 ± 0.41 |
| 3 | 2.51 ± 0.82 | 0.25 ± 0.20 | 1.98 ± 0.34 | 1.74 ± 0.77 | 1.15 ± 0.20 |
| 6 | 2.91 ± 0.22 | 0.28 ± 0.35 | 1.13 ± 0.49 | 0.79 ± 0.82 | 1.47 ± 0.28 |
Estimation of cellular arachidonic acid in unstimulated cells
Estimation of cellular arachidonic acid following stimulation with calcium ionophore (A23187)
Estimation of cellular arachidonic acid following stimulation with ATP
