HaCaT Proteomic Analysis Results
Preliminary analysis of the proteomic dataset
The aim of this study was to investigate the proteins related to the AA cascade using SWATH-MS. As this was a preliminary study, the results are presented as raw intensities.
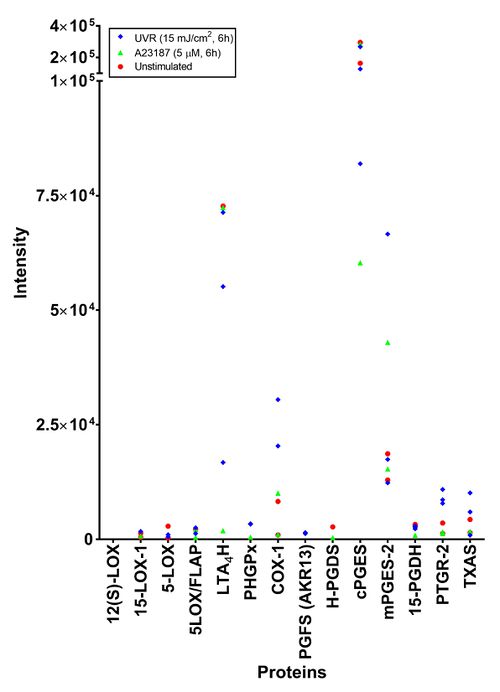
To investigate the effect of treatment on protein expression, cells stimulated with A23187 (5 µM, 6h), UVR (15 mJ/cm2, 6h) and unstimulated cells were analysed (Table *). The dose and exposure time of A23187 was selected as it corresponds to the experimental conditions. The dose and exposure time of UVR was selected as a previous unpublished study found high levels of COX-2 protein at 6h post irradiation using Western Blotting (Kiezel-Tsugunova, 2017). Unfortunately, experimental issues resulted in only n=2 samples being analysed for the unstimulated and the A23187 stimulated cells, whilst n=3 samples were analysed for the UVR stimulated cells.
Peptides were detected for all proteins responsible for the production of lipid mediators detected by LC-MS/MS, except for 12-LOX. Interestingly, peptides of known UVR inducible proteins (COX-2 and mPGES-1) were not detected in the irradiated samples. The protein that was detected at the highest mean intensity and the most consistently was cPGES, the cytosolic isoform of PGES. The most inconsistent protein was H-PGDS, the hematopoietic isoform of prostaglandin D synthase. When the different treatments were compared, no difference could be found.

| Unstimulated | A23187 (5 mM, 6h) | UVR (15 mJ/cm2, 6h) | |||||||
|---|---|---|---|---|---|---|---|---|---|
| Mean | SD | n | Mean | SD | n | Mean | SD | n | |
| 12(S)-LOX | |||||||||
| 15-LOX-1 | 1.72E+03 | 0.00E+00 | 1 | 8.28E+02 | 4.66E+02 | 3 | |||
| 5-LOX | 1.03E+03 | 0.00E+00 | 1 | 5.39E+02 | 0.00E+00 | 1 | 1.57E+03 | 1.83E+03 | 2 |
| 5LOX/FLAP | 1.68E+03 | 8.34E+02 | 3 | 2.16E+03 | 2.13E+03 | 2 | 1.31E+03 | 1.30E+03 | 2 |
| LTA4H | 6.33E+04 | 1.05E+04 | 4 | 9.33E+03 | 1.43E+04 | 4 | 7.25E+04 | 9.57E+03 | 4 |
| PHGPx | 3.42E+03 | 0.00E+00 | 1 | 2.35E+03 | 2.42E+03 | 3 | |||
| COX-1 | 3.05E+04 | 0.00E+00 | 1 | 1.52E+04 | 1.32E+04 | 4 | 3.43E+03 | 4.61E+03 | 6 |
| PGFS (AKR13) | 1.24E+03 | 0.00E+00 | 1 | 1.46E+03 | 0.00E+00 | 1 | |||
| H-PGDS | 3.61E+02 | 0.00E+00 | 1 | 2.71E+03 | 0.00E+00 | 1 | |||
| cPGES | 1.97E+05 | 1.05E+05 | 4 | 7.12E+04 | 1.72E+04 | 4 | 2.48E+05 | 9.60E+04 | 6 |
| mPGES-2 | 1.49E+04 | 5.91E+03 | 4 | 5.48E+04 | 1.81E+04 | 4 | 1.57E+04 | 2.77E+03 | 6 |
| 15-PGDH | 2.75E+03 | 2.22E+02 | 2 | 1.83E+03 | 1.37E+03 | 3 | 2.93E+03 | 1.26E+03 | 6 |
| PTGR-2 | 9.37E+03 | 6.40E+03 | 4 | 6.17E+03 | 4.56E+03 | 3 | 2.24E+03 | 1.53E+03 | 5 |
| TXAS | 8.06E+03 | 5.75E+03 | 4 | 1.31E+03 | 5.89E+02 | 2 | 2.88E+03 | 1.87E+03 | 4 |
Further analysis of the proteomic dataset
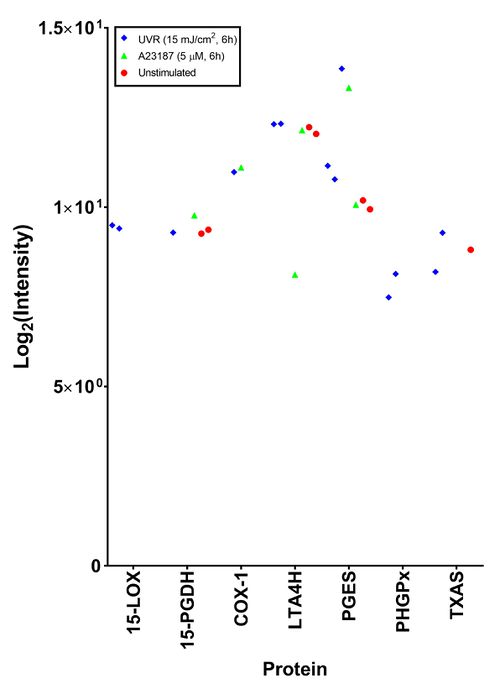
This analysis, performed by the Stoller centre, included taking the top three most intense peptide species, a 1% false discovery rate and acceptance of transition groups if it was identified in the majority of replicates. This in-depth analysis only found seven proteins related to the eicosanoid cascade. LTA4H and PGES were consistently identified across the three sample types. The isoform of the proteins detected was not specified.

| Unstimulated | A23187 (5 mM, 6h) | UVR (15 mJ/cm2, 6h) | |||||||
|---|---|---|---|---|---|---|---|---|---|
| Mean | SD | n | Mean | SD | n | Mean | SD | n | |
| 15-LOX | 9.45 | 0.065 | 2 | ||||||
| 15-PGDH | 9.29 | 0 | 1 | 9.47 | 0.27 | 3 | |||
| COX-1 | 11.04 | 0.091 | 2 | ||||||
| LTA4H | 12.17 | 0.25 | 3 | 8.12 | 0 | 1 | 12.14 | 0.093 | 3 |
| PGES | 10.89 | 0.23 | 3 | 13.6 | 0.38 | 2 | 10.07 | 0.12 | 3 |
| PHGPx | 7.49 | 0 | 1 | 4.07 | 5.76 | 2 | |||
| TXAS | 8.74 | 0.77 | 2 | 8.81 | 0 | 1 | |||