Difference between revisions of "Double-bond reductase (DBR)"
Aliah.hawari (talk | contribs) (→Simulations) |
Aliah.hawari (talk | contribs) (→Simulations) |
||
| Line 229: | Line 229: | ||
The DBR model have been used to simulate the biotransformation experiment from published experiments. Click on the pictures below to learn more: | The DBR model have been used to simulate the biotransformation experiment from published experiments. Click on the pictures below to learn more: | ||
| − | |||
| − | |||
| − | |||
<imagemap> | <imagemap> | ||
| − | File:DBR_biotrans_toogood_simulation.png| | + | File:DBR_biotrans_toogood_simulation.png| 500px |
rect 41 49 941 684 [[Simulating DBR Biotransformation]] | rect 41 49 941 684 [[Simulating DBR Biotransformation]] | ||
Revision as of 16:11, 12 August 2016
You can go back to main page of the kinetic model here.
Contents
Reaction catalysed

Enzyme and Metabolite Background Information
Long metabolite names are abbreviated in the model for clarity and standard identification purposes.
| Compound | Abbreviation | Chemical Formula | Molar mass (g/mol) | ChEBI | ChEMBL | PubChem | BRENDA | PlantCyc |
|---|---|---|---|---|---|---|---|---|
| Double-bond reductase | DBR | 37914 Da | 1.3.1.81 | |||||
| pulegone | C10H16O | 136.24 | ||||||
| menthone | ||||||||
| NADPH | C21H30N7O17P3 | 745.42116 | 16474 | |||||
| NADP+ | C21H29N7O17P3 | 744.41322 | 18009 | |||||
| isomenthone |
Equation Rate
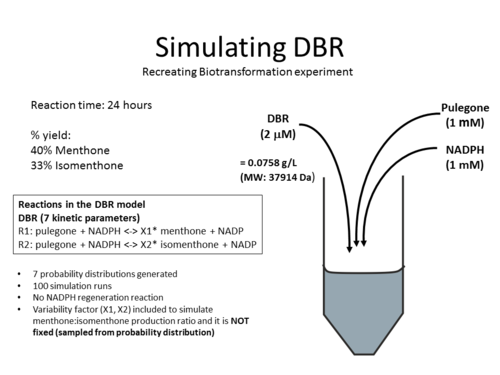
DBR is modelled using two equations that describes: 1) Pulegone to Menthone and 2) Pulegone to Isomenthone. The predominant product for DBR is menthone where the ratio of menthone to isomenthone production have been reported as 40:33 [1], 55:45 [2] and 70:30 [3]. To model the variability of the product yield for DBR, variability factors which are calculated from the average ratio is included in the equations.
Reaction 1: Conversion of pulegone to menthone
![V_\mathrm{DBR} = Kcat_\mathrm{forward} * X1*[DBR] * \cfrac {\left ( \cfrac{[pulegone]}{Km_\mathrm{pulegone}} * \cfrac {[NADPH]}{Km_\mathrm{NADPH}} \right ) * \left ( 1 - \cfrac {[menthone]*[NADP]}{[pulegone]*[NADPH]*K_\mathrm{eq}} \right )}
{ \left (1 + \cfrac {[Pulegone]}{Km_\mathrm{Pulegone}} + \cfrac {[NADP]}{Km_\mathrm{NADP}} \right ) + \left ( 1+ \cfrac {[NADPH]}{Km_\mathrm{NADPH}} + \cfrac {[menthone]}{Km_\mathrm{menthone}} \right ) }](/wiki/images/math/e/8/2/e8266ee0a10232ab7cf83510dde96773.png)
Reaction 2: Conversion of pulegone to isomenthone
![V_\mathrm{DBR} = Kcat_\mathrm{forward} *X2* [DBR] * \cfrac {\left ( \cfrac{[pulegone]}{Km_\mathrm{pulegone}} * \cfrac {[NADPH]}{Km_\mathrm{NADPH}} \right ) * \left ( 1 - \cfrac {[isomenthone]*[NADP]}{[pulegone]*[NADPH]*K_\mathrm{eq}} \right )}
{ \left (1 + \cfrac {[Pulegone]}{Km_\mathrm{Pulegone}} + \cfrac {[NADP]}{Km_\mathrm{NADP}} \right ) + \left ( 1+ \cfrac {[NADPH]}{Km_\mathrm{NADPH}} + \cfrac {[isomenthone]}{Km_\mathrm{isomenthone}} \right ) }](/wiki/images/math/b/1/f/b1f27f5e860b074806c3b452ce27db1c.png)
| Parameter | Description | Units |
|---|---|---|
| VPGR | Reaction rate for Limonene-3-hydroxylase | μM/min |
| Kcatforward | Catalytic constant in the forward direction | s-1 |
| Kmpulegone | Michaelis-Menten constant for pulegone | μM |
| Kmmenthone | Michaelis-Menten constant for menthone | μM |
| Kmisomenthone | Michaelis-Menten constant for isomenthone | μM |
| KmNADPH | Michaelis-Menten constant for NADPH | μM |
| KmNADP | Michaelis-Menten constant for NADP+ | μM |
| Keq | Equilibrium constant | |
| X1 , X2 | Variability factors | |
| [PGR] | enzyme concentration | μM |
| [pulegone] | Pulegone concentration | μM |
| [menthone] | Menthone concentration | μM |
| [isomenthone] | Isomenthone concentration | μM |
| [NADPH] | NADPH concentration | μM |
| [NADP] | NADP+ concentration | μM |
Strategies for estimating the kinetic parameter values
Standard Gibbs Free energy
The Gibbs free energy for PGR is -3.9565125 kcal.mol^-1. This value is estimated from the 'Contribution group' method by Latendresse, M. and is available from MetaCyc (EC 1.3.1.81) [4].
Calculating the Equilibrium Constant
The equilibrium constant can be calculated using the Van't Hoff Isotherm equation:
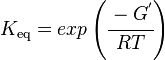
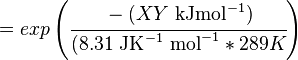
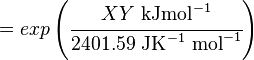
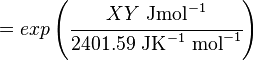
where;
| Keq | Equilibrium constant |
| -ΔG° | Gibbs free energy change. For (INSERT ENZYME) it is (INSERT VALUE) kJmol-1 |
| R | Gas constant with a value of 8.31 JK-1mol-1 |
| T | Temperature which is always expressed in kelvin |
Extracting Information from menthone Production Rates
A table will go here
Published Kinetic Parameter Values
Km Values
| Parameter | Directionality | Substrate / Product | Value | unit | Method notes | References |
|---|---|---|---|---|---|---|
| Km | Forward | pulegone | 2.3 | µM | Gene from peppermint oil gland secretory cell cDNA, expressed in E. coli, optimal pH 5.0, menthone:isomenthone ratio of 55:45 | Ringer2003 |
| Km | Forward | pulegone | 2.9 | µM | Gene from peppermint oil gland secretory cell cDNA, expressed in E. coli, optimal pH 5.0, menthone:isomenthone ratio of 55:45, Km 2.3 +/- 0.6 | Ringer2003 |
| Km | Forward | NADPH | 6.9 | µM | Gene from peppermint oil gland secretory cell cDNA, expressed in E. coli, optimal pH 5.0, menthone:isomenthone ratio of 55:45 | Ringer2003 |
Detailed description of kinetic values obtained from literature
A more detailed description of the values listed above can be found here .
Simulations
The DBR model have been used to simulate the biotransformation experiment from published experiments. Click on the pictures below to learn more:

References
- ↑ 1.0 1.1 Toogood, H. et. al.2015. "Enzymatic menthol production: One-pot approach using engioneered Escherichia coli ", ACS Synthetic Biology, 4:1112-1123 Cite error: Invalid
<ref>tag; name "Toogood2015" defined multiple times with different content - ↑ Ringer, K.L. et. al. 2003. "Monoterpene double-bond reductases of the (-)-menthol biosynthetic pathway:isolation and characterization of cDNAs encoding (-)-isopiperitenone reductase and (+)-pulegone reductase of peppermint", Archives of Biochemistry and Biophysics 418:80-92
- ↑ Solodar, J. 1976. "Stereoselective reduction of menthone and isomenthone by dissolving alkali metals and by hydrogen with Group 8 Metals on carbon", The Journal of Organic Chemistry, 41(21):3461-3464
- ↑ Latendresse M. (2013). "Computing Gibbs Free Energy of Compounds and Reactions in MetaCyc."