Difference between revisions of "HaCaT MTT Assay Results"
(Created page with " Return to overview In this study, the aim was to identify optimal conditions for the following experiments. Thes...") |
(→Cell viability) |
||
| (7 intermediate revisions by the same user not shown) | |||
| Line 1: | Line 1: | ||
[[Welcome to the In-Silico Model of Cutaneous Lipids Wiki | Return to overview]] | [[Welcome to the In-Silico Model of Cutaneous Lipids Wiki | Return to overview]] | ||
| + | |||
| + | [[HaCaT keratinocytes|Return to HaCaT keratinocytes]] | ||
In this study, the aim was to identify optimal conditions for the following experiments. These assays were performed using the MTT assay. | In this study, the aim was to identify optimal conditions for the following experiments. These assays were performed using the MTT assay. | ||
| − | == Optimum | + | == Optimum seeding density == |
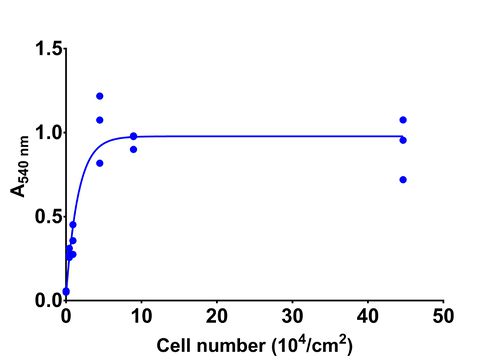
| − | HaCaT keratinocytes were seeded at set densities between 0.4-44 x104 cells/cm2 in order to create a growth curve (Figure *). The exponential growth phase was identified between 0.4 x10 | + | HaCaT keratinocytes were seeded at set densities between 0.4-44 x104 cells/cm2 in order to create a growth curve (Figure *). The exponential growth phase was identified between 0.4 x10^4 and 4 x10^4 cells/cm2. As a result, a value in the centre of the exponential growth phase was selected (2 x10^4 cells/cm2) and used in all future experiments. |
| + | [[Image:Copy_of_HaCaTs_-_per_cm2_-_use.jpg|none|thumb|500px|The absorbance of various seeding densities (0.4-44 x10^4 cells/cm2) of HaCaT keratinocytes after 48h. The data presented is from three independent experiments. ]] | ||
| + | {| class="wikitable" | ||
| + | |+ style="text-align: left;" |The absorbance of various seeding densities (0.4-44 x104 cells/cm2) of HaCaT keratinocytes after 48h. The data presented is mean ± SD from three independent experiments. | ||
| + | |- | ||
| + | ! style="text-align: center; font-weight:bold;" | Cell number (10^4/cm2) | ||
| + | ! style="text-align: center; font-weight:bold;" | A540 nm | ||
| + | |- | ||
| + | | style="text-align: center;" | 0 | ||
| + | | style="text-align: center;" | 0.05 ± 0.00 | ||
| + | |- | ||
| + | | style="text-align: center;" | 0.44 | ||
| + | | style="text-align: center;" | 0.28 ± 0.03 | ||
| + | |- | ||
| + | | style="text-align: center;" | 0.91 | ||
| + | | style="text-align: center;" | 0.36 ± 0.09 | ||
| + | |- | ||
| + | | style="text-align: center;" | 4.47 | ||
| + | | style="text-align: center;" | 1.04 ± 0.20 | ||
| + | |- | ||
| + | | style="text-align: center;" | 8.94 | ||
| + | | style="text-align: center;" | 0.95 ± 0.05 | ||
| + | |- | ||
| + | | style="text-align: center;" | 44.66 | ||
| + | | style="text-align: center;" | 0.92 ± 0.18 | ||
| + | |} | ||
== Cell viability == | == Cell viability == | ||
| + | HaCaT keratinocytes were exposed to varying doses of A23187, ATP and UVR to assess toxicity. The range of doses which were assessed was based upon doses used in the literature (Norris et al., 2014, Sjursen et al., 2000, Aries et al., 2005, Gresham et al., 1996). | ||
| + | |||
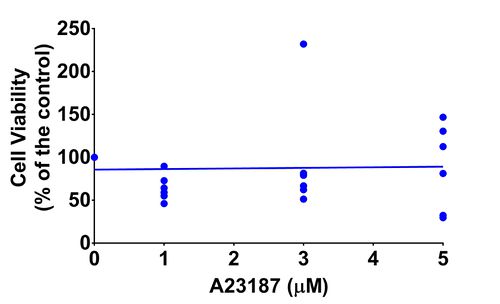
| + | When the viability was assessed for cells exposed to A23187 (0-5 µM) for 6h, the mean of all doses was found to be above 80% except 1 µM. 5 µM was used in future experiments as the mean viability was above 80% and it had previously been shown to upregulate the AA cascade (Aries et al., 2005, Sjursen et al., 2000). | ||
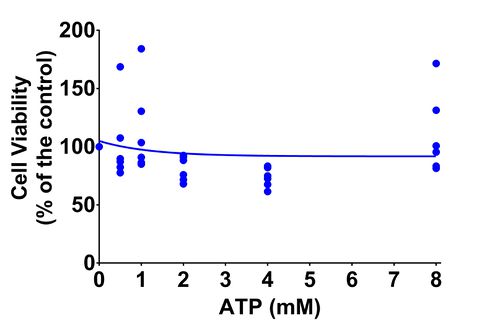
| + | The mean viability of cells exposed to ATP (0-8 mM) for 6h was found to remain above 80% for all doses. Based upon previous reports, 2 mM of ATP was sufficient to upregulate the AA cascade (Norris et al., 2014), therefore was used in future experiments. | ||
| + | |||
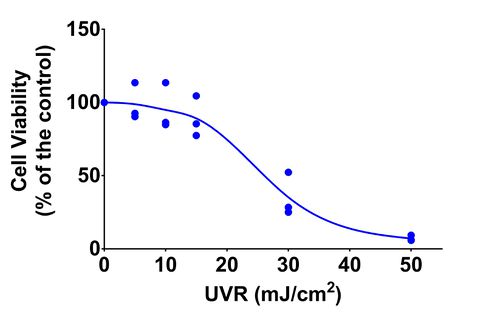
| + | The mean viability of cells following irradiation with UVR (0-50 mJ/cm2) was found to decrease as the dose of UVR increased. 15 mJ/cm2 was found to be the highest dose of UVR where the mean viability of cells was over 80% after 6h. As a result, this was used for all future experiments. | ||
| + | |||
| + | === Calcium Ionophore === | ||
| + | |||
| + | [[Image:Copy_of_H+CI_%_Viability.jpg|none|thumb|500px|The effect of A23187 (0-5 µM) on the viability of HaCaT keratinocytes. Cells were incubated for 6h with the stimulus and the data presented is from six independent experiments. ]] | ||
| + | |||
| + | {| class="wikitable" | ||
| + | |+ style="text-align: left;" |The effect of A23187 (0-5 µM) on the viability of HaCaT keratinocytes. Cells were incubated for 6h with the stimulus and the data presented is mean ± SD from six independent experiments. | ||
| + | |- | ||
| + | ! style="text-align: center; font-weight:bold;" | A23187 (µM) | ||
| + | ! style="text-align: center; font-weight:bold;" | Cell Viability (% of the control) | ||
| + | |- | ||
| + | | style="text-align: center;" | 0 | ||
| + | | style="text-align: center;" | 100.00 ± 0.00 | ||
| + | |- | ||
| + | | style="text-align: center;" | 1 | ||
| + | | style="text-align: center;" | 64.42 ± 15.19 | ||
| + | |- | ||
| + | | style="text-align: center;" | 3 | ||
| + | | style="text-align: center;" | 95.42 ± 67.83 | ||
| + | |- | ||
| + | | style="text-align: center;" | 5 | ||
| + | | style="text-align: center;" | 88.75 ± 49.79 | ||
| + | |- | ||
| + | |} | ||
| + | |||
| + | === ATP === | ||
| + | |||
| + | [[Image:Copy_of_H+ATP_%_Viability.jpg|none|thumb|500px|The effect of ATP (0-8 mM) on the viability of HaCaT keratinocytes. Cells were incubated for 6h with the stimulus and the data presented is from six independent experiments. ]] | ||
| + | |||
| + | {| class="wikitable" | ||
| + | |+ style="text-align: left;" |The effect of ATP (0-8 mM) on the viability of HaCaT keratinocytes. Cells were incubated for 6h with the stimulus and the data presented is mean ± SD from six independent experiments. | ||
| + | ! style="text-align: center; font-weight:bold;" | ATP (mM) | ||
| + | ! style="text-align: center; font-weight:bold;" | Cell Viability (% of the control) | ||
| + | |- | ||
| + | | style="text-align: center;" | 0 | ||
| + | | style="text-align: center;" | 100.00 ± 0.00 | ||
| + | |- | ||
| + | | style="text-align: center;" | 0.5 | ||
| + | | style="text-align: center;" | 102.18 ± 34.13 | ||
| + | |- | ||
| + | | style="text-align: center;" | 1 | ||
| + | | style="text-align: center;" | 113.40 ± 38.55 | ||
| + | |- | ||
| + | | style="text-align: center;" | 2 | ||
| + | | style="text-align: center;" | 81.26 ± 10.64 | ||
| + | |- | ||
| + | | style="text-align: center;" | 4 | ||
| + | | style="text-align: center;" | 73.65 ± 8.40 | ||
| + | |- | ||
| + | | style="text-align: center;" | 8 | ||
| + | | style="text-align: center;" | 110.63 ± 34.83 | ||
| + | |} | ||
| + | |||
| + | === UVR === | ||
| + | |||
| + | [[Image:Copy_of_UVR_Hacat_%_Viability.jpg|none|thumb|500px|The effect of UVR (0-50 mJ/cm2) on the viability of HaCaT keratinocytes. Cells were incubated for 6h following stimulation and the data presented is from three independent experiments.]] | ||
| + | |||
| + | {| class="wikitable" | ||
| + | |+ style="text-align: left;" |The effect of UVR (0-50 mJ/cm2) on the viability of HaCaT keratinocytes. Cells were incubated for 6h following stimulation and the data presented is mean ± SD from three independent experiments. | ||
| + | ! style="text-align: center; font-weight:bold;" | UVR (mJ/cm2) | ||
| + | ! style="text-align: center; font-weight:bold;" | Cell Viability (% of the control) | ||
| + | |- | ||
| + | | style="text-align: center;" | 0 | ||
| + | | style="text-align: center;" | 100.00 ± 0.00 | ||
| + | |- | ||
| + | | style="text-align: center;" | 5 | ||
| + | | style="text-align: center;" | 98.80 ± 12.80 | ||
| + | |- | ||
| + | | style="text-align: center;" | 10 | ||
| + | | style="text-align: center;" | 94.89 ± 16.15 | ||
| + | |- | ||
| + | | style="text-align: center;" | 15 | ||
| + | | style="text-align: center;" | 89.11 ± 13.92 | ||
| + | |- | ||
| + | | style="text-align: center;" | 30 | ||
| + | | style="text-align: center;" | 35.21 ± 14.84 | ||
| + | |- | ||
| + | | style="text-align: center;" | 50 | ||
| + | | style="text-align: center;" | 7.04 ± 1.92 | ||
| + | |} | ||
Latest revision as of 14:13, 31 May 2019
In this study, the aim was to identify optimal conditions for the following experiments. These assays were performed using the MTT assay.
Optimum seeding density
HaCaT keratinocytes were seeded at set densities between 0.4-44 x104 cells/cm2 in order to create a growth curve (Figure *). The exponential growth phase was identified between 0.4 x10^4 and 4 x10^4 cells/cm2. As a result, a value in the centre of the exponential growth phase was selected (2 x10^4 cells/cm2) and used in all future experiments.
| Cell number (10^4/cm2) | A540 nm |
|---|---|
| 0 | 0.05 ± 0.00 |
| 0.44 | 0.28 ± 0.03 |
| 0.91 | 0.36 ± 0.09 |
| 4.47 | 1.04 ± 0.20 |
| 8.94 | 0.95 ± 0.05 |
| 44.66 | 0.92 ± 0.18 |
Cell viability
HaCaT keratinocytes were exposed to varying doses of A23187, ATP and UVR to assess toxicity. The range of doses which were assessed was based upon doses used in the literature (Norris et al., 2014, Sjursen et al., 2000, Aries et al., 2005, Gresham et al., 1996).
When the viability was assessed for cells exposed to A23187 (0-5 µM) for 6h, the mean of all doses was found to be above 80% except 1 µM. 5 µM was used in future experiments as the mean viability was above 80% and it had previously been shown to upregulate the AA cascade (Aries et al., 2005, Sjursen et al., 2000). The mean viability of cells exposed to ATP (0-8 mM) for 6h was found to remain above 80% for all doses. Based upon previous reports, 2 mM of ATP was sufficient to upregulate the AA cascade (Norris et al., 2014), therefore was used in future experiments.
The mean viability of cells following irradiation with UVR (0-50 mJ/cm2) was found to decrease as the dose of UVR increased. 15 mJ/cm2 was found to be the highest dose of UVR where the mean viability of cells was over 80% after 6h. As a result, this was used for all future experiments.
Calcium Ionophore
| A23187 (µM) | Cell Viability (% of the control) |
|---|---|
| 0 | 100.00 ± 0.00 |
| 1 | 64.42 ± 15.19 |
| 3 | 95.42 ± 67.83 |
| 5 | 88.75 ± 49.79 |
ATP
| ATP (mM) | Cell Viability (% of the control) |
|---|---|
| 0 | 100.00 ± 0.00 |
| 0.5 | 102.18 ± 34.13 |
| 1 | 113.40 ± 38.55 |
| 2 | 81.26 ± 10.64 |
| 4 | 73.65 ± 8.40 |
| 8 | 110.63 ± 34.83 |
UVR
| UVR (mJ/cm2) | Cell Viability (% of the control) |
|---|---|
| 0 | 100.00 ± 0.00 |
| 5 | 98.80 ± 12.80 |
| 10 | 94.89 ± 16.15 |
| 15 | 89.11 ± 13.92 |
| 30 | 35.21 ± 14.84 |
| 50 | 7.04 ± 1.92 |


