Difference between revisions of "Transformation of LTA4 to LTB4"
(→Enzyme concentration) |
|||
| Line 1: | Line 1: | ||
[[Welcome to the In-Silico Model of Cutaneous Lipids Wiki | Return to overview]] | [[Welcome to the In-Silico Model of Cutaneous Lipids Wiki | Return to overview]] | ||
| + | |||
| + | LTA4 is subsequently enzymatically hydrolysed to LTB4 by LTA4 hydrolase (LTA4H). The enzyme performs this reaction by opening the epoxide and creating a carbocation intermediate. The charge of the carbocation delocalises over the triene system and is subsequently subject to nucleophilic attack by water at C12, resulting in the stereospecific addition of a hydroxyl group and the generation of LTB4. | ||
| + | |||
| + | |||
== Reaction == | == Reaction == | ||
Latest revision as of 08:39, 21 August 2019
LTA4 is subsequently enzymatically hydrolysed to LTB4 by LTA4 hydrolase (LTA4H). The enzyme performs this reaction by opening the epoxide and creating a carbocation intermediate. The charge of the carbocation delocalises over the triene system and is subsequently subject to nucleophilic attack by water at C12, resulting in the stereospecific addition of a hydroxyl group and the generation of LTB4.
Contents
Reaction
Chemical equation

Rate equation
Parameters
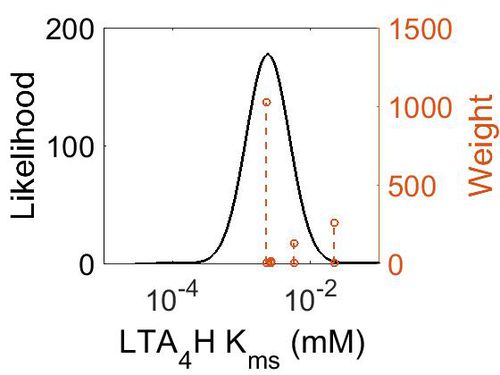
Kms
| Value | Units | Species | Notes | Weight | Reference |
|---|---|---|---|---|---|
| 5.80E-03 | mM | Human | Expression Vector: E. Coli
Enzyme: Wild Type Leukotriene A4 hydrolase: pH:8 Temperature: 20 (Room Temperature) |
128 | [1] |
| 2.70E-03 | mM | Frog | Expression Vector: oocytes
Enzyme: leukotriene A4 hydrolase pH:8 Temperature: 20 (Room Temperature) |
16 | [2] |
| 2.20E-02 | mM | Human | Expression Vector: Leukocytes
Enzyme: Leukotriene A4 Hydrolase pH: 8 Temperature:2°C |
256 | [3] |
| 2.30E-03 | Expression Vector: Leukocytes
Enzyme: Leukotriene A4 Hydrolase pH: 8 Temperature:37°C |
1024 |
| Mode (mM) | Confidence Interval | Location parameter (µ) | Scale parameter (σ) |
|---|---|---|---|
| 2.40E-03 | 5.77E+00 | -5.51E+00 | 7.20E-01 |
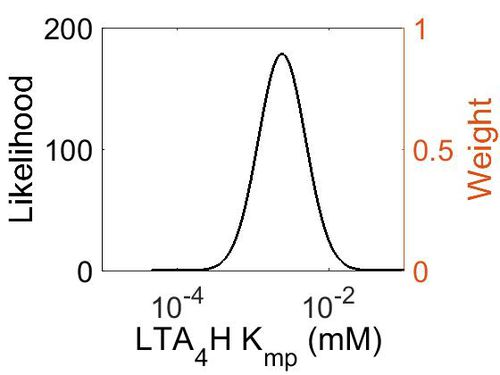
Kmp
| Mode (mM) | Location parameter (µ) | Scale parameter (σ) |
|---|---|---|
| 2.40E-03 | -5.51E+00 | 7.17E-01 |
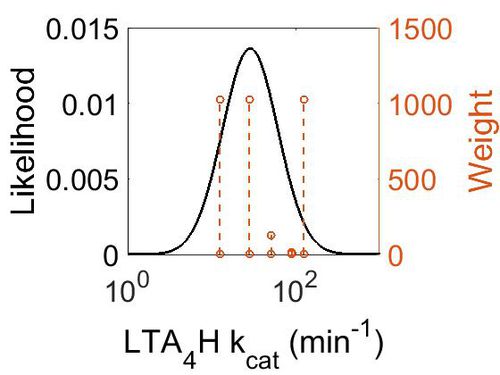
kcat
| Value | Units | Species | Notes | Weight | Reference |
|---|---|---|---|---|---|
| 12.6 - 28.2 | per minute | Human | Expression Vector: E. Coli.
Enzyme: Leukotriene A4 Hydrolase pH: 7.4 Temperature: 37 °C |
1024 | [4] |
| 51 | per minute | Human | Expression Vector: E. Coli
Enzyme: Wild Type Leukotriene A4 hydrolase: pH:8 Temperature: 20 (Room Temperature) |
128 | [1] |
| 90 | per minute | Frog | Expression Vector: oocytes
Enzyme: leukotriene A4 hydrolase pH:8 Temperature: 20 (Room Temperature) |
16 | [2] |
| 125 | per minute | Human | Expression Vector: Leukocytes
Enzyme: Leukotriene A4 Hydrolase pH: 8 Temperature:37°C |
1024 | [3] |
| Mode (min-1) | Confidence Interval | Location parameter (µ) | Scale parameter (σ) |
|---|---|---|---|
| 2.85E+01 | 6.56E+00 | 3.94E+00 | 7.60E-01 |
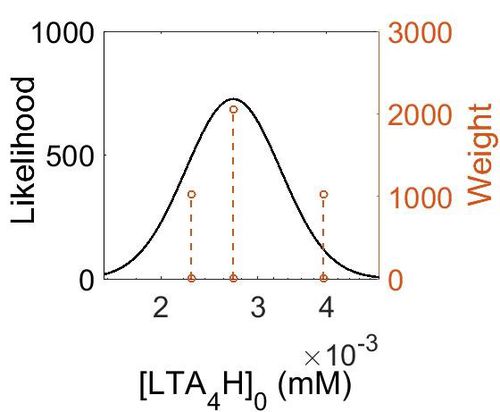
Enzyme concentration
To convert the enzyme concentration from ppm to mM, the following equation was used.
| Value | Units | Species | Notes | Weight | Reference |
|---|---|---|---|---|---|
| 714 | 
|
Human | Expression Vector: Lung
Enzyme: LTA4H pH: 7.5 Temperature: 37 °C |
1024 | [5] |
| 489 | 
|
Human | Expression Vector: Skin
Enzyme: LTA4H pH: 7.5 Temperature: 37 °C |
2048 | [6] |
| 410 | 
|
Human | Expression Vector: Oral Cavity
Enzyme: LTA4H pH: 7.5 Temperature: 37 °C |
1024 | [6] |
| Mode (ppm) | Mode (mM) | Confidence Interval | Location parameter (µ) | Scale parameter (σ) |
|---|---|---|---|---|
| 4.88E+02 | 2.70E-03 | 1.25E+00 | 6.24E+00 | 2.19E-01 |
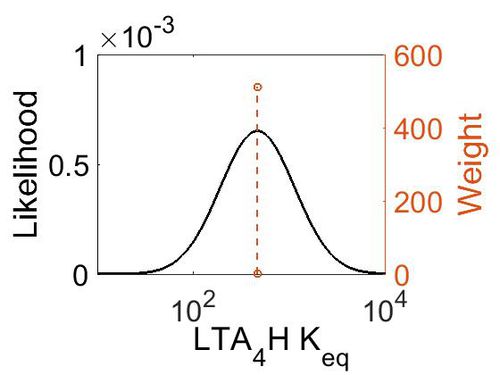
Keq
| Gibbs Free Energy Change | Units | Species | Notes | Weight | Reference |
|---|---|---|---|---|---|
| (-3.6329994) | kcal/mol | Not stated | Estimated
Enzyme: LTA4H Substrate: LTA4 Product: LTB4 pH: 7.3 ionic strength: 0.25 |
64 | [7] |
| Mode | Confidence Interval | Location parameter (µ) | Scale parameter (σ) |
|---|---|---|---|
| 4.64E+02 | 1.00E+01 | 6.93E+00 | 8.90E-01 |
References
- ↑ 1.0 1.1 [www.ncbi.nlm.nih.gov/pubmed/8650196 Mueller M. , "Leukotriene A4 hydrolase: protection from mechanism-based inactivation by mutation of tyrosine-378. Proc Natl Acad Sci U S A. 1996 Jun 11;93(12):5931-5.]
- ↑ 2.0 2.1 [www.ncbi.nlm.nih.gov/pubmed/9744798 Stromberg F. , "Purification and characterization of leukotriene A4 hydrolase from Xenopus laevis oocytes. FEBS Lett. 1998 Aug 21;433(3):219-22.]
- ↑ 3.0 3.1 [www.ncbi.nlm.nih.gov/pubmed/6490615 Radmark O. , "Leukotriene A4 hydrolase in human leukocytes. Purification and properties J Biol Chem. 1984 Oct 25;259(20):12339-45.]
- ↑ [www.ncbi.nlm.nih.gov/pubmed/11675384 Rudberg P. , "Leukotriene A4 Hydrolase/Aminopeptidase The Journal of Biological Chemistry, 277, 1398-1404.]
- ↑ M. Kim A draft map of the human proteome Nature, 2014 509, 575–581
- ↑ 6.0 6.1 M. Wilhelm Mass-spectrometry-based draft of the human proteome Nature, 2014 509, 582–587
- ↑ Caspi et al 2014, "The MetaCyc database of metabolic pathways and enzymes and the BioCyc collection of Pathway/Genome Databases," Nucleic Acids Research 42:D459-D471


