Difference between revisions of "Transformation of 15-HPETE to 15-HETE"
(→Parameters) |
|||
| (One intermediate revision by the same user not shown) | |||
| Line 1: | Line 1: | ||
[[Welcome to the In-Silico Model of Cutaneous Lipids Wiki | Return to overview]] | [[Welcome to the In-Silico Model of Cutaneous Lipids Wiki | Return to overview]] | ||
| − | 15-HPETE | + | Upon being generated, 15-HPETE can be reduced by an oxidoreductase enzyme, phospholipid hydroperoxide glutathione peroxidase (PHGPx), to form 15-HETE respectively. |
| − | |||
== Reaction == | == Reaction == | ||
| Line 125: | Line 124: | ||
=== Enzyme concentration === | === Enzyme concentration === | ||
| + | |||
| + | To convert the enzyme concentration from ppm to mM, the following [[Common equations#Enzyme concentration (mM)|equation]] was used. | ||
{|class="wikitable sortable" | {|class="wikitable sortable" | ||
| Line 180: | Line 181: | ||
{| class="wikitable" | {| class="wikitable" | ||
|+ style="text-align: left;" | Description of the PHGPx concentration distribution | |+ style="text-align: left;" | Description of the PHGPx concentration distribution | ||
| − | ! Mode (mM) !! Confidence Interval !! Location parameter (µ) !! Scale parameter (σ) | + | ! Mode (ppm) !! Mode (mM) !! Confidence Interval !! Location parameter (µ) !! Scale parameter (σ) |
|- | |- | ||
| − | | 3.14E+02 || 1.38E+00 || 5.85E+00 || 3.09E-01 | + | | 3.14E+02 || 1.74E-03|| 1.38E+00 || 5.85E+00 || 3.09E-01 |
|} | |} | ||
Latest revision as of 08:21, 21 August 2019
Upon being generated, 15-HPETE can be reduced by an oxidoreductase enzyme, phospholipid hydroperoxide glutathione peroxidase (PHGPx), to form 15-HETE respectively.
Contents
Reaction
Chemical equation

Rate equation
Parameters
Note that the literature values are the same as reaction 12.
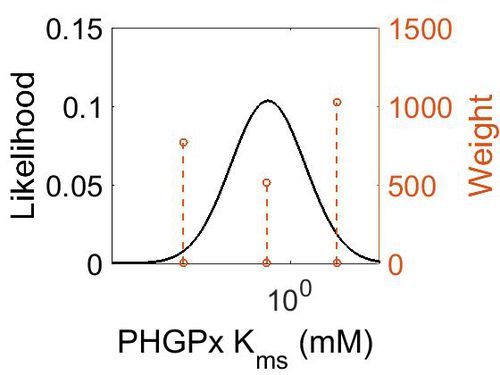
Kms
| Value | Units | Species | Notes | Weight | Reference |
|---|---|---|---|---|---|
| 3.00E-01 | 
|
Human | Expression Vector: Bioimprited Enzyme - Selenosubtilisin
Enzyme: Glutathione Peroxidase pH: 7 Temperature: 37 |
512 | [1] |
| 11.1 ± 2.90E-01 | 
|
Human | Expression Vector: E Coli
Enzyme: Wild Type Glutathione Peroxidase Enzyme (Se-hGSTZ1-1) pH: 7 Temperature: 37 |
1024 | [2] |
| 4.00E-03 | 
|
Rat | Expression Vector: Rat Liver Cells
Enzyme: Glutathione Peroxidase pH: 7.4 Temperature: 37 |
768 | [3] |
| Mode (mM) | Confidence Interval | Location parameter (µ) | Scale parameter (σ) |
|---|---|---|---|
| 3.19E-01 | 1.02E+03 | 2.54E+00 | 1.92E+00 |
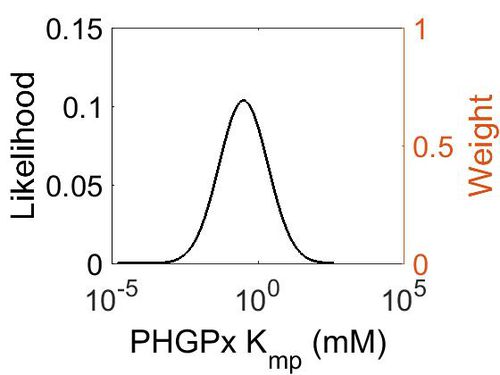
Kmp
This is a “Dependent parameter”, meaning that the log-normal distribution for this parameter was calculated using multivariate distributions (this is discussed in detail here). As a result, no confidence interval factor or literature values were cited for this parameter.
| Mode (mM) | Location parameter (µ) | Scale parameter (σ) |
|---|---|---|
| 3.15E-01 | 2.53E+00 | 1.92E+00 |
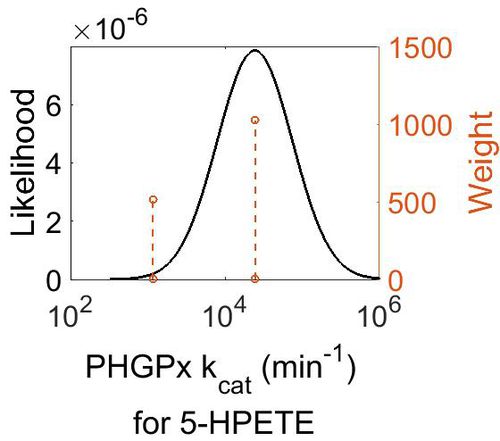
kcat
| Value | Units | Species | Notes | Weight | Reference |
|---|---|---|---|---|---|
| 1170 ± 50 | 
|
Human | Expression Vector: Bioimprited Enzyme - Selenosubtilisin
Enzyme: Glutathione Peroxidase pH: 7 Temperature: 37 |
512 | [1] |
| 24500 ± 150 | 
|
Human | Expression Vector: E Coli
Enzyme: Wild Type Glutathione Peroxidase Enzyme (Se-hGSTZ1-1) pH: 7 Temperature: 37 |
1024 | [2] |
| Mode (min-1) | Confidence Interval | Locati1024on parameter (µ) | Scale parameter (σ) |
|---|---|---|---|
| 2.44E+04 | 4.20E+00 | 1.11E+01 | 9.75E-01 |
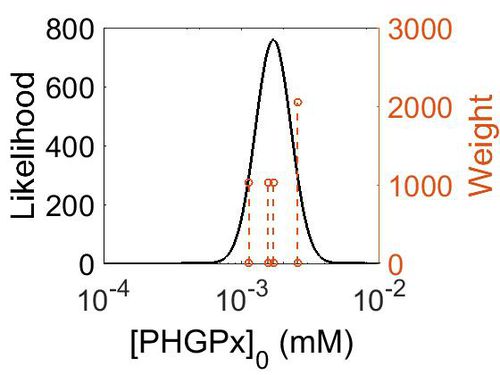
Enzyme concentration
To convert the enzyme concentration from ppm to mM, the following equation was used.
| Value | Units | Species | Notes | Weight | Reference |
|---|---|---|---|---|---|
| 459 | 
|
Human | Expression Vector: Skin
Enzyme: PHGPx pH: 7.5 Temperature: 37 °C |
2048 | [4] |
| 307 | 
|
Human | Expression Vector: Lung
Enzyme: PHGPx pH: 7.5 Temperature: 37 °C |
1024 | [4] |
| 282 | 
|
Human | Expression Vector: Esophagus
Enzyme: PHGPx pH: 7.5 Temperature: 37 °C |
1024 | [4] |
| 204 | 
|
Human | Expression Vector: Gut
Enzyme: PHGPx pH: 7.5 Temperature: 37 °C |
1024 | [5] |
| Mode (ppm) | Mode (mM) | Confidence Interval | Location parameter (µ) | Scale parameter (σ) |
|---|---|---|---|---|
| 3.14E+02 | 1.74E-03 | 1.38E+00 | 5.85E+00 | 3.09E-01 |
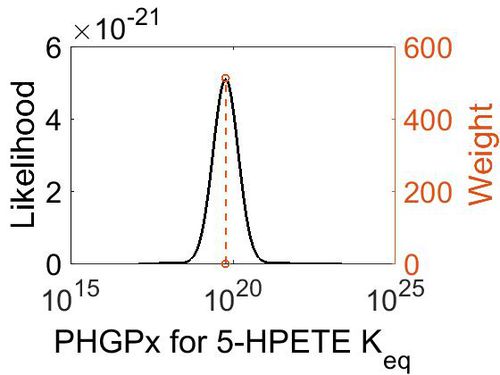
Keq
| Gibbs Free Energy Change | Units | Species | Notes | Weight | Reference |
|---|---|---|---|---|---|
| (-26.941177) | kcal/mol | Not stated | Estimated
Enzyme: PHGPx Substrate:a hydroperoxy-fatty-acyl-[lipid] Product: a hydroxy-fatty-acyl-[lipid] pH: 7.3 ionic strength: 0.25 |
64 | [6] |
| Mode | Confidence Interval | Location parameter (µ) | Scale parameter (σ) |
|---|---|---|---|
| 5.90E+19 | 1.00E+01 | 4.63E+01 | 8.90E-01 |
Related Reactions
- ↑ 1.0 1.1 Liu L. "Functional mimicry of the active site of glutathione peroxidase by glutathione imprinted selenium-containing protein. Biomacromolecules. 2008 Jan;9(1):363-8. doi: 10.1021/bm7008312. Epub 2007 Dec 29.
- ↑ 2.0 2.1 Zheng K. "A novel selenium-containing glutathione transferase zeta1-1, the activity of which surpasses the level of some native glutathione peroxidases. Int J Biochem Cell Biol. 2008;40(10):2090-7. doi: 10.1016/j.biocel.2008.02.006. Epub 2008 Feb 15.
- ↑ Hiratsuka A. "Subunit Ya-specific glutathione peroxidase activity toward cholesterol 7-hydroperoxides of glutathione S-transferases in cytosols from rat liver and skin. J Biol Chem. 1997 Feb 21;272(8):4763-9.
- ↑ 4.0 4.1 4.2 M. Wilhelm Mass-spectrometry-based draft of the human proteome Nature, 2014 509, 582–587
- ↑ M. Kim A draft map of the human proteome Nature, 2014 509, 575–581
- ↑ Caspi et al 2014, "The MetaCyc database of metabolic pathways and enzymes and the BioCyc collection of Pathway/Genome Databases," Nucleic Acids Research 42:D459-D471


