Difference between revisions of "Transformation of PGH2 to TXA2"
(→Keq) |
(→Parameters) |
||
| (7 intermediate revisions by the same user not shown) | |||
| Line 1: | Line 1: | ||
[[Welcome to the In-Silico Model of Cutaneous Lipids Wiki | Return to overview]] | [[Welcome to the In-Silico Model of Cutaneous Lipids Wiki | Return to overview]] | ||
| − | The isomerisation of PGH2 to TXA2 is performed by TXAS. This reaction includes the rearrangement of the peroxide functional group by the protein’s heme group, whereby one oxygen is incorporated into the cyclopentane ring between C11 and C12 to form | + | The isomerisation of PGH2 to TXA2 is performed by thromboxane A synthase (TXAS). This reaction includes the rearrangement of the peroxide functional group by the protein’s heme group, whereby one oxygen is incorporated into the cyclopentane ring between C11 and C12 to form a tetrahydropyran ring, whilst the other oxygen forms a trimethylene oxide ring across the tetrahydropyran ring between C9 and C11. |
| − | |||
| − | |||
== Reaction == | == Reaction == | ||
| Line 26: | Line 24: | ||
! Species | ! Species | ||
! Notes | ! Notes | ||
| + | ! Weight | ||
! Reference | ! Reference | ||
|- | |- | ||
| Line 35: | Line 34: | ||
pH: 7.4 | pH: 7.4 | ||
Temperature: 37 | Temperature: 37 | ||
| + | |2048 | ||
|<ref name="Orlandi1994"> [http://www.ncbi.nlm.nih.gov/pubmed/7811713 M. Orlandi, G. Bartolini, Thromboxane A2 synthase activity in platelet free human monocytes.'' Biochim Biophys Acta. 1994 Dec 8;1215(3):285-90.]</ref> | |<ref name="Orlandi1994"> [http://www.ncbi.nlm.nih.gov/pubmed/7811713 M. Orlandi, G. Bartolini, Thromboxane A2 synthase activity in platelet free human monocytes.'' Biochim Biophys Acta. 1994 Dec 8;1215(3):285-90.]</ref> | ||
|- | |- | ||
| Line 44: | Line 44: | ||
pH:7.4 | pH:7.4 | ||
Temperature: | Temperature: | ||
| + | |512 | ||
|<ref name="Nusing1989"> [http://www.ncbi.nlm.nih.gov/pubmed/2195994 R. Nusing, S. Schneider-Voss and V. Ullrich, Immunoaffinity purification of human thromboxane synthase.'' Arch Biochem Biophys. 1990 Aug 1;280(2):325-30.]</ref> | |<ref name="Nusing1989"> [http://www.ncbi.nlm.nih.gov/pubmed/2195994 R. Nusing, S. Schneider-Voss and V. Ullrich, Immunoaffinity purification of human thromboxane synthase.'' Arch Biochem Biophys. 1990 Aug 1;280(2):325-30.]</ref> | ||
|- | |- | ||
| Line 53: | Line 54: | ||
pH: 7.4 | pH: 7.4 | ||
Temperature: 37 | Temperature: 37 | ||
| + | |2048 | ||
|<ref name="Hecker1989"> [http://www.ncbi.nlm.nih.gov/pubmed/2491846 Hecker M. ''On the mechanism of prostacyclin and thromboxane A2 biosynthesis.''J Biol Chem. 1989 Jan 5;264(1):141-50.]</ref> | |<ref name="Hecker1989"> [http://www.ncbi.nlm.nih.gov/pubmed/2491846 Hecker M. ''On the mechanism of prostacyclin and thromboxane A2 biosynthesis.''J Biol Chem. 1989 Jan 5;264(1):141-50.]</ref> | ||
|- | |- | ||
| Line 67: | Line 69: | ||
=== K<sub>mp</sub> === | === K<sub>mp</sub> === | ||
| + | This is a “Dependent parameter”, meaning that the log-normal distribution for this parameter was calculated using multivariate distributions (this is discussed in detail[[Quantification of parameter uncertainty | here]]). As a result, no confidence interval factor or literature values were cited for this parameter. | ||
{| class="wikitable" | {| class="wikitable" | ||
|+ style="text-align: left;" | Description of the TXAS Kmp distribution | |+ style="text-align: left;" | Description of the TXAS Kmp distribution | ||
| Line 85: | Line 88: | ||
! Species | ! Species | ||
! Notes | ! Notes | ||
| + | ! Weight | ||
! Reference | ! Reference | ||
|- | |- | ||
| Line 94: | Line 98: | ||
pH: 7.4 | pH: 7.4 | ||
Temperature:30 | Temperature:30 | ||
| − | |<ref name=" | + | |512 |
| + | |<ref name="Hecker19871”>[www.ncbi.nlm.nih.gov/pubmed/3579292 Hecker M. “Products, kinetics, and substrate specificity of homogeneous thromboxane synthase from human platelets: Development of a novel enzyme assay ” Arch. Biochem. Biophys. 1987, 254, 124-135]</ref> | ||
|- | |- | ||
|1628 | |1628 | ||
| Line 103: | Line 108: | ||
pH:7.4 | pH:7.4 | ||
Temperature:37 | Temperature:37 | ||
| − | |<ref name=" | + | |2048 |
| + | |<ref name="Haurand19851”>[www.ncbi.nlm.nih.gov/pubmed/2999104 Haurand M. “Isolation and characterization of thromboxane synthase from human platelets as a cytochrome P-450 enzyme” J Biol Chem. 1985, 260 (5), 15059-15067]</ref> | ||
|- | |- | ||
|} | |} | ||
| Line 117: | Line 123: | ||
=== Enzyme concentration === | === Enzyme concentration === | ||
| + | To convert the enzyme concentration from ppm to mM, the following [[Common equations#Enzyme concentration (mM)|equation]] was used. | ||
{|class="wikitable sortable" | {|class="wikitable sortable" | ||
| Line 125: | Line 132: | ||
! Species | ! Species | ||
! Notes | ! Notes | ||
| + | ! Weight | ||
! Reference | ! Reference | ||
|- | |- | ||
| Line 134: | Line 142: | ||
pH: 7.5 | pH: 7.5 | ||
Temperature: 37 °C | Temperature: 37 °C | ||
| + | |1024 | ||
|<ref name="Kim2014"> [http://www.nature.com/nature/journal/v509/n7502/pdf/nature13302.pdf M. Kim ''A draft map of the human proteome'' Nature, 2014 509, 575–581]</ref> | |<ref name="Kim2014"> [http://www.nature.com/nature/journal/v509/n7502/pdf/nature13302.pdf M. Kim ''A draft map of the human proteome'' Nature, 2014 509, 575–581]</ref> | ||
|- | |- | ||
| Line 143: | Line 152: | ||
pH: 7.5 | pH: 7.5 | ||
Temperature: 37 °C | Temperature: 37 °C | ||
| + | |1024 | ||
|<ref name="Kim2014"> [http://www.nature.com/nature/journal/v509/n7502/pdf/nature13302.pdf M. Kim ''A draft map of the human proteome'' Nature, 2014 509, 575–581]</ref> | |<ref name="Kim2014"> [http://www.nature.com/nature/journal/v509/n7502/pdf/nature13302.pdf M. Kim ''A draft map of the human proteome'' Nature, 2014 509, 575–581]</ref> | ||
|- | |- | ||
| Line 152: | Line 162: | ||
pH: 7.5 | pH: 7.5 | ||
Temperature: 37 °C | Temperature: 37 °C | ||
| + | |1024 | ||
|<ref name="Kim2014"> [http://www.nature.com/nature/journal/v509/n7502/pdf/nature13302.pdf M. Kim ''A draft map of the human proteome'' Nature, 2014 509, 575–581]</ref> | |<ref name="Kim2014"> [http://www.nature.com/nature/journal/v509/n7502/pdf/nature13302.pdf M. Kim ''A draft map of the human proteome'' Nature, 2014 509, 575–581]</ref> | ||
|- | |- | ||
| Line 161: | Line 172: | ||
pH: 7.5 | pH: 7.5 | ||
Temperature: 37 °C | Temperature: 37 °C | ||
| + | |1024 | ||
|<ref name="Wilhelm2014"> [http://www.nature.com/nature/journal/v509/n7502/pdf/nature13319.pdf M. Wilhelm ''Mass-spectrometry-based draft of the human proteome'' Nature, 2014 509, 582–587]</ref> | |<ref name="Wilhelm2014"> [http://www.nature.com/nature/journal/v509/n7502/pdf/nature13319.pdf M. Wilhelm ''Mass-spectrometry-based draft of the human proteome'' Nature, 2014 509, 582–587]</ref> | ||
|- | |- | ||
| Line 167: | Line 179: | ||
{| class="wikitable" | {| class="wikitable" | ||
|+ style="text-align: left;" | Description of the TXAS concentration distribution | |+ style="text-align: left;" | Description of the TXAS concentration distribution | ||
| − | ! Mode !! Confidence Interval !! Location parameter (µ) !! Scale parameter (σ) | + | ! Mode (ppm) !! Mode (mM) !! Confidence Interval !! Location parameter (µ) !! Scale parameter (σ) |
|- | |- | ||
| − | | 7.50E+01 || 6.69E+00 || 5.66E+00 || 1.16E+00 | + | | 7.50E+01 ||4.15E-04 || 6.69E+00 || 5.66E+00 || 1.16E+00 |
|} | |} | ||
| Line 183: | Line 195: | ||
! Species | ! Species | ||
! Notes | ! Notes | ||
| + | ! Weight | ||
! Reference | ! Reference | ||
|- | |- | ||
| Line 194: | Line 207: | ||
pH: 7.3 | pH: 7.3 | ||
ionic strength: 0.25 | ionic strength: 0.25 | ||
| + | |64 | ||
|<ref name="MetaCyc”>[http://metacyc.org/META/NEW-IMAGE?type=REACTION&object=THROMBOXANE-A-SYNTHASE-RXN Caspi et al 2014, "The MetaCyc database of metabolic pathways and enzymes and the BioCyc collection of Pathway/Genome Databases," Nucleic Acids Research 42:D459-D471]</ref> | |<ref name="MetaCyc”>[http://metacyc.org/META/NEW-IMAGE?type=REACTION&object=THROMBOXANE-A-SYNTHASE-RXN Caspi et al 2014, "The MetaCyc database of metabolic pathways and enzymes and the BioCyc collection of Pathway/Genome Databases," Nucleic Acids Research 42:D459-D471]</ref> | ||
|} | |} | ||
Latest revision as of 10:06, 2 November 2019
The isomerisation of PGH2 to TXA2 is performed by thromboxane A synthase (TXAS). This reaction includes the rearrangement of the peroxide functional group by the protein’s heme group, whereby one oxygen is incorporated into the cyclopentane ring between C11 and C12 to form a tetrahydropyran ring, whilst the other oxygen forms a trimethylene oxide ring across the tetrahydropyran ring between C9 and C11.
Contents
Reaction
Chemical equation

Rate equation
Parameters
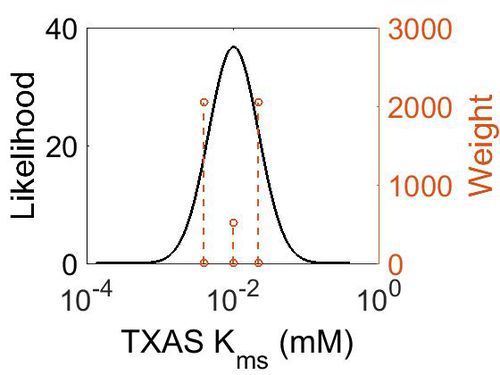
Kms
| Value | Units | Species | Notes | Weight | Reference |
|---|---|---|---|---|---|
| 4.00E-03 | 
|
Human | Expression Vector: Human Monocyte
Enzyme: Platelet Free Human Monocyte pH: 7.4 Temperature: 37 |
2048 | [1] |
| 1.00E-02 | 
|
Human | Expression Vector: Human mirosome
Enzyme: Human Thromboxane Synthase pH:7.4 Temperature: |
512 | [2] |
| 2.20E-02 | 
|
Human | Expression Vector:Human platelet
Enzyme: Human thromboxane synthase pH: 7.4 Temperature: 37 |
2048 | [3] |
| Mode (mM) | Confidence Interval | Location parameter (µ) | Scale parameter (σ) |
|---|---|---|---|
| 9.96E-03 | 2.25E+00 | -3.9721 | 0.78374 |
Kmp
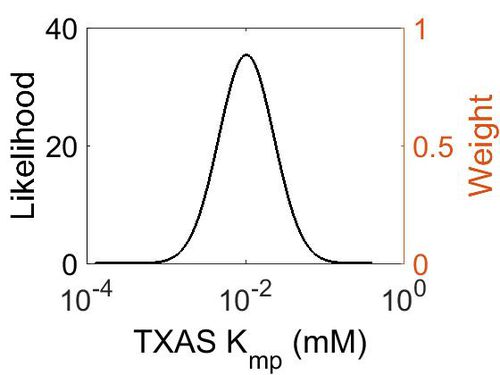
This is a “Dependent parameter”, meaning that the log-normal distribution for this parameter was calculated using multivariate distributions (this is discussed in detail here). As a result, no confidence interval factor or literature values were cited for this parameter.
| Mode (mM) | Location parameter (µ) | Scale parameter (σ) |
|---|---|---|
| 1.03E-02 | -3.942048511 | 0.797944323 |
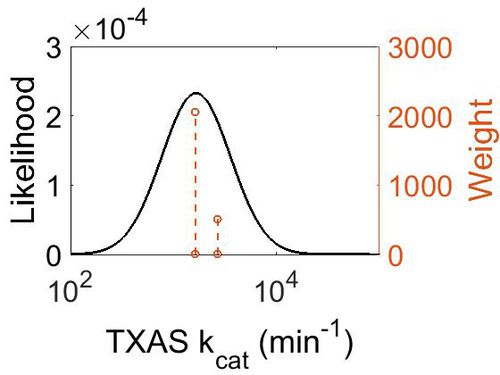
kcat
| Value | Units | Species | Notes | Weight | Reference |
|---|---|---|---|---|---|
| 2687 | per minute | Human | Expression Vector: Human Platelets
Enzyme: TXAS pH: 7.4 Temperature:30 |
512 | [4] |
| 1628 | per minute | Human | Expression Vector:Platelet Microsomes
Enzyme: TXAS pH:7.4 Temperature:37 |
2048 | [5] |
| Mode (min-1) | Confidence Interval | Location parameter (µ) | Scale parameter (σ) |
|---|---|---|---|
| 1.67E+03 | 1.25E+00 | 7.467597712 | 0.216816683 |
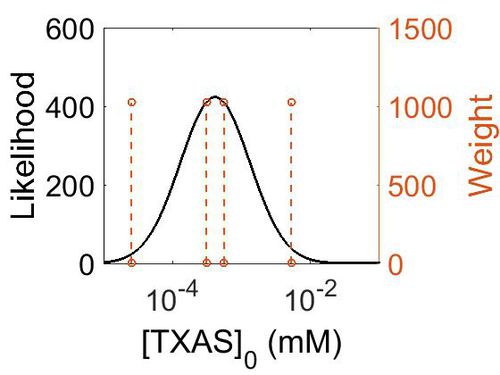
Enzyme concentration
To convert the enzyme concentration from ppm to mM, the following equation was used.
| Value | Units | Species | Notes | Weight | Reference |
|---|---|---|---|---|---|
| 949 | 
|
Human | Expression Vector: Platelet
Enzyme: TXAS pH: 7.5 Temperature: 37 °C |
1024 | [6] |
| 56.2 | 
|
Human | Expression Vector: Lung
Enzyme: TXAS pH: 7.5 Temperature: 37 °C |
1024 | [6] |
| 4.58 | 
|
Human | Expression Vector: Urinary Bladder
Enzyme: TXAS pH: 7.5 Temperature: 37 °C |
1024 | [6] |
| 101 | 
|
Human | Expression Vector: Oral Cavity
Enzyme: TXAS pH: 7.5 Temperature: 37 °C |
1024 | [7] |
| Mode (ppm) | Mode (mM) | Confidence Interval | Location parameter (µ) | Scale parameter (σ) |
|---|---|---|---|---|
| 7.50E+01 | 4.15E-04 | 6.69E+00 | 5.66E+00 | 1.16E+00 |
Keq
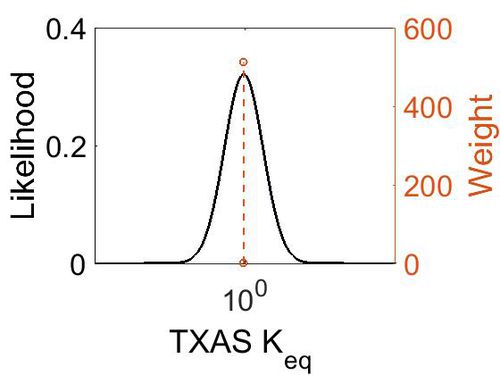
| Value | Units | Species | Notes | Weight | Reference |
|---|---|---|---|---|---|
| 41.08 | kcal/mol | Not stated | Estimated
Enzyme: TXAS Substrate: Arachidonate Product: TXA2 pH: 7.3 ionic strength: 0.25 |
64 | [8] |
| Mode | Confidence Interval | Location parameter (µ) | Scale parameter (σ) |
|---|---|---|---|
| 9.35E-01 | 1.00E+01 | 7.30E-01 | 8.90E-01 |
References
- ↑ M. Orlandi, G. Bartolini, Thromboxane A2 synthase activity in platelet free human monocytes. Biochim Biophys Acta. 1994 Dec 8;1215(3):285-90.
- ↑ R. Nusing, S. Schneider-Voss and V. Ullrich, Immunoaffinity purification of human thromboxane synthase. Arch Biochem Biophys. 1990 Aug 1;280(2):325-30.
- ↑ Hecker M. On the mechanism of prostacyclin and thromboxane A2 biosynthesis.J Biol Chem. 1989 Jan 5;264(1):141-50.
- ↑ [www.ncbi.nlm.nih.gov/pubmed/3579292 Hecker M. “Products, kinetics, and substrate specificity of homogeneous thromboxane synthase from human platelets: Development of a novel enzyme assay ” Arch. Biochem. Biophys. 1987, 254, 124-135]
- ↑ [www.ncbi.nlm.nih.gov/pubmed/2999104 Haurand M. “Isolation and characterization of thromboxane synthase from human platelets as a cytochrome P-450 enzyme” J Biol Chem. 1985, 260 (5), 15059-15067]
- ↑ 6.0 6.1 6.2 M. Kim A draft map of the human proteome Nature, 2014 509, 575–581
- ↑ M. Wilhelm Mass-spectrometry-based draft of the human proteome Nature, 2014 509, 582–587
- ↑ Caspi et al 2014, "The MetaCyc database of metabolic pathways and enzymes and the BioCyc collection of Pathway/Genome Databases," Nucleic Acids Research 42:D459-D471


