Difference between revisions of "HaCaT Fatty acid analysis Results"
| (6 intermediate revisions by the same user not shown) | |||
| Line 1: | Line 1: | ||
[[HaCaT keratinocytes|Return to HaCaT keratinocytes]] | [[HaCaT keratinocytes|Return to HaCaT keratinocytes]] | ||
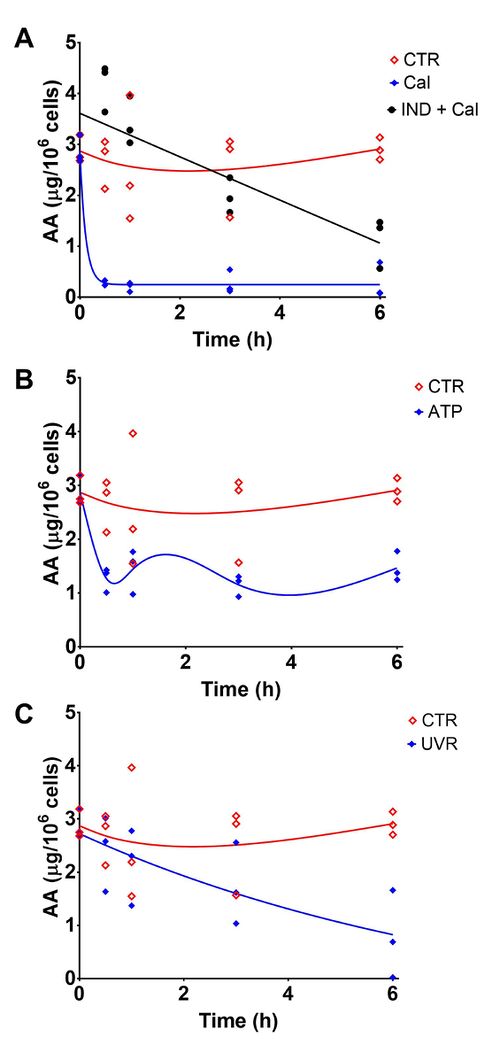
| − | + | The aim of this study was to estimate the levels of AA in cells which were unstimulated and stimulated with A23187 (with/without COX inhibition), ATP and UVR. GC-FID was used for this fatty acid analysis and the values were normalized using cell numbers (ug /10<sup>6</sup> cells). | |
{| class="wikitable" | {| class="wikitable" | ||
| − | |+ style="text-align: left;" |The estimated AA levels in HaCaT keratinocytes (unstimulated, A23187 (5µM), COX inhibited and A23187 (5 µM), ATP (2 mM) and UVR (15 mJ/cm2)) for 0.5, 1, 3 and 6h. Analysis was performed using GC-FID. Results are expressed mean ± SD (ug/ | + | |+ style="text-align: left;" |The estimated AA levels in HaCaT keratinocytes (unstimulated, A23187 (5µM), COX inhibited and A23187 (5 µM), ATP (2 mM) and UVR (15 mJ/cm2)) for 0.5, 1, 3 and 6h. Analysis was performed using GC-FID. Results are expressed mean ± SD (ug/10<sup>6</sup> cells) of three independent experiments. |
|- | |- | ||
! rowspan="2" style="text-align: center; font-weight:bold;" | Time (h) | ! rowspan="2" style="text-align: center; font-weight:bold;" | Time (h) | ||
| Line 51: | Line 51: | ||
|} | |} | ||
| − | |||
| − | [[Image: | + | [[Image:Hacat_AA.jpg|none|thumb|500px|Levels of cellular arachidonic acid in HaCaT keratinocytes following stimulation with (A) A23187, (B) UVR and (C) ATP 6h post stimulation. Data points are from n=3 independent experiments. Non-linear lines of best fit are shown for untreated control cells (red), treated cells (blue) and treated with indomethacin and A23187 cells (black). Abbreviations: control cells (CTR), calcium ionophore (A23187, 5 µM) (CaI) and indomethacin (10 mM, 1h) (IND). ]] |
| − | |||
| − | |||
| − | |||
| − | |||
| − | |||
| − | |||
| − | |||
| − | |||
| − | |||
| − | |||
| − | |||
| − | |||
| − | |||
Latest revision as of 13:08, 26 August 2019
The aim of this study was to estimate the levels of AA in cells which were unstimulated and stimulated with A23187 (with/without COX inhibition), ATP and UVR. GC-FID was used for this fatty acid analysis and the values were normalized using cell numbers (ug /106 cells).
| Time (h) | Experiment | ||||
|---|---|---|---|---|---|
| Unstimulated | A23187 | Indomethacin + A23187 | UVR | ATP | |
| 0 | 2.87 ± 0.28 | 2.87 ± 0.28 | 2.87 ± 0.28 | 2.87 ± 0.28 | 2.87 ± 0.28 |
| 0.5 | 2.68 ± 0.49 | 0.28 ± 0.07 | 4.18 ± 0.47 | 2.41 ± 0.70 | 1.27 ± 0.23 |
| 1 | 2.57 ± 1.25 | 0.21 ± 0.09 | 3.42 ± 0.47 | 2.15 ± 0.72 | 1.44 ± 0.41 |
| 3 | 2.51 ± 0.82 | 0.25 ± 0.20 | 1.98 ± 0.34 | 1.74 ± 0.77 | 1.15 ± 0.20 |
| 6 | 2.91 ± 0.22 | 0.28 ± 0.35 | 1.13 ± 0.49 | 0.79 ± 0.82 | 1.47 ± 0.28 |

Levels of cellular arachidonic acid in HaCaT keratinocytes following stimulation with (A) A23187, (B) UVR and (C) ATP 6h post stimulation. Data points are from n=3 independent experiments. Non-linear lines of best fit are shown for untreated control cells (red), treated cells (blue) and treated with indomethacin and A23187 cells (black). Abbreviations: control cells (CTR), calcium ionophore (A23187, 5 µM) (CaI) and indomethacin (10 mM, 1h) (IND).