Difference between revisions of "Transformation of K6PGF1a to exK6PGF1a by PGT"
(Created page with " Return to overview Prostaglandin Transporter == Rate equation == File:R109.PN...") |
(→Transport Parameters) |
||
| Line 8: | Line 8: | ||
== Transport Parameters == | == Transport Parameters == | ||
| − | + | ===K<sub>ms</sub>=== | |
{|class="wikitable sortable" | {|class="wikitable sortable" | ||
| − | |+ style="text-align: left;" | | + | |+ style="text-align: left;" | Literature values |
|- | |- | ||
! Value | ! Value | ||
| Line 136: | Line 136: | ||
|} | |} | ||
| + | {| class="wikitable" | ||
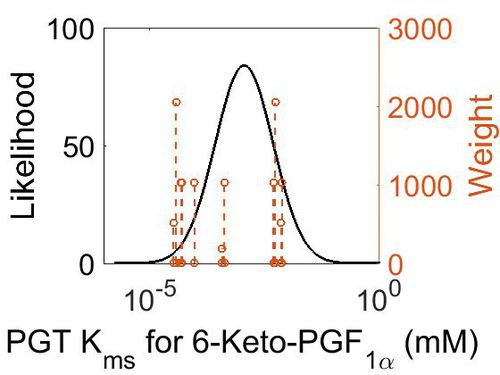
| + | |+ style="text-align: left;" | Description of the PGT Kms distribution | ||
| + | ! Mode (mM) !! Confidence Interval !! Location parameter (µ) !! Scale parameter (σ) | ||
| + | |- | ||
| + | | 1.10E-03 || 9.42E+01 || -4.67E+00 || 1.45E+00 | ||
| + | |} | ||
| + | |||
| + | [[Image:141.jpg|none|thumb|500px|The estimated probability distribution for PGT Kms. The value and weight of the literature values used to define the distribution are indicated by an orange dashed line. The x axis is plotted on a log-scale. ]] | ||
| + | ===k<sub>cat</sub>=== | ||
No data available on the turnover of PGT/ an organic molecule transporter therefore based upon estimates made by http://book.bionumbers.org/what-are-the-rates-of-membrane-transporters/ | No data available on the turnover of PGT/ an organic molecule transporter therefore based upon estimates made by http://book.bionumbers.org/what-are-the-rates-of-membrane-transporters/ | ||
{|class="wikitable sortable" | {|class="wikitable sortable" | ||
| − | |+ style="text-align: left;" | | + | |+ style="text-align: left;" | Literature values |
|- | |- | ||
! Value | ! Value | ||
| Line 170: | Line 179: | ||
|} | |} | ||
| + | {| class="wikitable" | ||
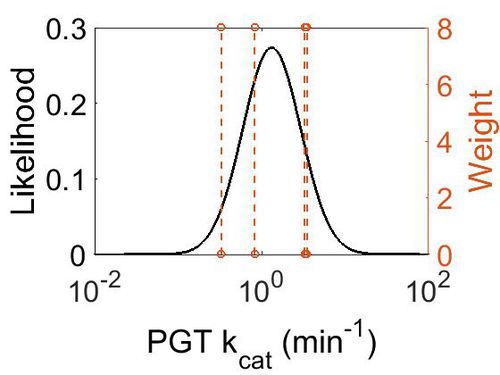
| + | |+ style="text-align: left;" | Description of the PGT kcat distribution | ||
| + | ! Mode (min-1) !! Confidence Interval !! Location parameter (µ) !! Scale parameter (σ) | ||
| + | |- | ||
| + | | 1.33E+00 || 7.30E+00 || 9.20E-01 || 8.00E-01 | ||
| + | |} | ||
| + | |||
| + | [[Image:132.jpg|none|thumb|500px|The estimated probability distribution for PGT kcat. The value and weight of the literature values used to define the distribution are indicated by an orange dashed line. The x axis is plotted on a log-scale. ]] | ||
| + | |||
| + | === Transporter concentration === | ||
{|class="wikitable sortable" | {|class="wikitable sortable" | ||
| − | |+ style="text-align: left;" | | + | |+ style="text-align: left;" | Literature values |
|- | |- | ||
! Value | ! Value | ||
| Line 208: | Line 227: | ||
|} | |} | ||
| + | {| class="wikitable" | ||
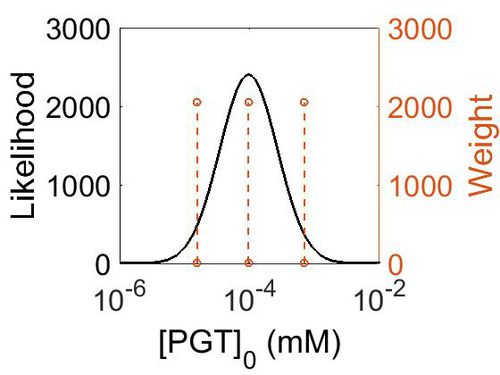
| + | |+ style="text-align: left;" | Description of the PGT concentration distribution | ||
| + | ! Mode (mM) !! Confidence Interval !! Location parameter (µ) !! Scale parameter (σ) | ||
| + | |- | ||
| + | | 1.73E+01 || 4.72E+00 || 3.90E+00 || 1.02E+00 | ||
| + | |} | ||
| + | |||
| + | [[Image:165.jpg|none|thumb|500px|The estimated probability distribution for PGT concentration. The value and weight of the literature values used to define the distribution are indicated by an orange dashed line. The x axis is plotted on a log-scale. ]] | ||
== References == | == References == | ||
<references/> | <references/> | ||
Revision as of 14:31, 16 May 2019
Contents
Rate equation
Transport Parameters
Kms
| Value | Units | Species | Notes | Reference |
|---|---|---|---|---|
| 0.0054 | mM | Human Eye | Vector: HEK-OATP2A1 or HEK-OATP2B1 and the respective vector controls
Substrate: Latanoprost, a prostaglandin F2a analogue pH: 7.5 Temp: 37 °C |
[1] |
| 0.000331 ± 0.000131 | mM | Transfected Human embryonic kidney cells (HEK293) | Substrate: PGE2
pH: unknown Temp: 37 °C |
[2] |
| 0.007202 ± 0.000595 | mM | Transfected Human embryonic kidney cells (HEK293) | Substrate: PGE3
pH: unknown Temp: 37 °C |
[2] |
| 0.000376 ± 3.4e-5 | mM | PGT-expressing Madin-Darby Canine Kidney Epithelial Cells (MDCK) cells | Substrate: PGH2
pH: unknown Temp: unknown |
[3] |
| 9.40E-05 | mM | Human | Substrate: PGE2
Species: Human Vector: HeLa Cell Line pH: 7 Temperature: 27 |
[4] |
| 0.000423 | mM | Human | Substrate: TXB2
Species: Human Vector: HeLa Cell Line pH: 7 Temperature: 27 |
[4] |
| 0.007569 | mM | Human | Substrate: 6-Keto-PGF1a
Species: Human Vector: HeLa Cell Line pH: 7 Temperature: 27 |
[4] |
| 4.87E-05 | mM | Human | Substrate: PGE2
Species: Human Vector: HeLa Cell Line pH: 7 Temperature: 27 |
[5] |
| 5.02E-05 | mM | Human | Substrate: PGF2a
Species: Human Vector: HeLa Cell Line pH: 7 Temperature: 27 |
[5] |
| 0.005 | mM | Human | Substrate: 15-Keto-PGE2
Species: Human Vector: HeLa Cell Line pH: 7 Temperature: 27 |
[5] |
| 0.005 | mM | Human | Substrate: 13,14-Dihydo-15-Keto-PGE2
Species: Human Vector: HeLa Cell Line pH: 7 Temperature: 27 |
[5] |
| 3.82E-05 | mM | Human | Substrate: PGH2
Species: Human Vector: HeLa Cell Line pH: 7 Temperature: 27 |
[5] |
| Mode (mM) | Confidence Interval | Location parameter (µ) | Scale parameter (σ) |
|---|---|---|---|
| 1.10E-03 | 9.42E+01 | -4.67E+00 | 1.45E+00 |
kcat
No data available on the turnover of PGT/ an organic molecule transporter therefore based upon estimates made by http://book.bionumbers.org/what-are-the-rates-of-membrane-transporters/
| Value | Units | Transporter | Notes | Reference |
|---|---|---|---|---|
| 3.5 | min-1 | Glucose transporter ptsI | Organism: Bacteria Escherichia coli
Back of the envelope calculation by BioNumbers: http://bionumbers.hms.harvard.edu/bionumber.aspx?&id=102931 |
[6] |
| 0.33 - 0.83 | min-1 | Rate of transport of H+/Lactose transporter | Organism: Bacteria Escherichia coli
Back of the envelop calculation on bionumbers http://bionumbers.hms.harvard.edu/bionumber.aspx?&id=103159 |
[7] |
| 3.28 | min-1 | Catalytic Rate of transporter HXT7 | Organism: Budding yeast Saccharomyces cerevisiae
Back of the envelope calculation http://bionumbers.hms.harvard.edu/bionumber.aspx?&id=101737 |
[8] |
| Mode (min-1) | Confidence Interval | Location parameter (µ) | Scale parameter (σ) |
|---|---|---|---|
| 1.33E+00 | 7.30E+00 | 9.20E-01 | 8.00E-01 |
Transporter concentration
| Value | Units | Species | Notes | Reference |
|---|---|---|---|---|
| 125 | ppm | Human | Vector:Lung
Enzyme: SLCO2A1 pH: 7.5 Temperature: 37 °C |
[9] |
| 17.4 | ppm | Human | Expression Vector: Esophagus
Enzyme: SLCO2A1 pH: 7.5 Temperature: 37 °C |
[10] |
| 2.82 | ppm | Human | Vector:Gut
Enzyme: SLCO2A1 pH: 7.5 Temperature: 37 °C |
[9] |
| Mode (mM) | Confidence Interval | Location parameter (µ) | Scale parameter (σ) |
|---|---|---|---|
| 1.73E+01 | 4.72E+00 | 3.90E+00 | 1.02E+00 |
References
- ↑ M. Kraft The prostaglandin transporter OATP2A1 is expressed in human ocular tissues and transports the antiglaucoma prostanoid latanoprost. Invest Ophthalmol Vis Sci. 2010 May;51(5):2504-11. doi: 10.1167/iovs.09-4290. Epub 2009 Dec 17.
- ↑ 2.0 2.1 Gose T. Prostaglandin transporter (OATP2A1/SLCO2A1) contributes to local disposition of eicosapentaenoic acid-derived PGE3. Prostaglandins Other Lipid Mediat. 2016 Jan;122:10-7. doi: 10.1016/j.prostaglandins.2015.12.003. Epub 2015 Dec 10.
- ↑ Chi Y. The prostaglandin transporter PGT transports PGH2 Biochemical and Biophysical Research Communications, Volume 395, Issue 2, 30 April 2010, Pages 168–172
- ↑ 4.0 4.1 4.2 [http://science.sciencemag.org/content/sci/268/5212/866.full.pdf Kanai N. Identification and Characterization of a Prostaglandin Transporter Science 12 May 1995:Vol. 268, Issue 5212, pp. 866-869, DOI: 10.1126/science.7754369]
- ↑ 5.0 5.1 5.2 5.3 5.4 Shigekazu I. Structural Determinants of Substrates for the Prostaglandin Transporter PGT Molecular Pharmacology October 1996, 50 (4) 736-742; DOI: https://doi.org/10.1124/mol.50.4.736
- ↑ Waygood EB Enzyme I of the phosphoenolpyruvate: sugar phosphotransferase system of Escherichia coli. Purification to homogeneity and some properties.Can J Biochem. 1980 Jan;58(1):40-8.
- ↑ Naftalin R. J. ELactose permease H+-lactose symporter: mechanical switch or Brownian ratchet?Biophys J. 2007 May 15;92(10):3474-91. Epub 2007 Feb 26.
- ↑ Ye L. Expression and activity of the Hxt7 high-affinity hexose transporter of Saccharomyces cerevisiaeYeast. 2001 Sep 30;18(13):1257-67.
- ↑ 9.0 9.1 M. Kim A draft map of the human proteome Nature, 2014 509, 575–581
- ↑ M. Wilhelm Mass-spectrometry-based draft of the human proteome Nature, 2014 509, 582–587


