Difference between revisions of "Transformation of PGE2 to 15-Keto-PGE2"
(→15-PGDH Parameters) |
|||
| Line 16: | Line 16: | ||
[[File:R66.PNG|center|500px]] | [[File:R66.PNG|center|500px]] | ||
| − | == | + | == Enzyme Parameters == |
| − | + | === K<sub>ms</sub>=== | |
| − | |||
{|class="wikitable sortable" | {|class="wikitable sortable" | ||
| − | |+ style="text-align: left;" | | + | |+ style="text-align: left;" | Literature values |
|- | |- | ||
! Value | ! Value | ||
| Line 96: | Line 95: | ||
|} | |} | ||
| + | {| class="wikitable" | ||
| + | |+ style="text-align: left;" | Description of the 15-PGDH Kms distribution | ||
| + | ! Mode (mM) !! Confidence Interval !! Location parameter (μ) !! Scale parameter (σ) | ||
| + | |- | ||
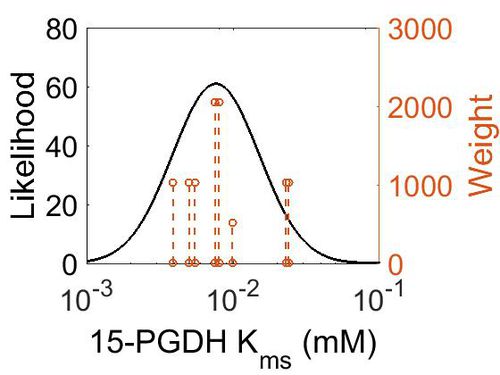
| + | | 7.64E-03 || 5.05E+00 || -4.41E+00 || 6.80E-01 | ||
| + | |} | ||
| + | |||
| + | [[Image:73.jpg|none|thumb|500px|The estimated probability distribution for 15-PGDH Kms. The value and weight of the literature values used to define the distribution are indicated by an orange dashed line. The x axis is plotted on a log-scale. ]] | ||
| + | ===K<sub>mp</sub>=== | ||
| + | {| class="wikitable" | ||
| + | |+ style="text-align: left;" | Description of the 15-PGDH Kmp distribution | ||
| + | ! Mode (mM) !! Location parameter (μ) !! Scale parameter (σ) | ||
| + | |- | ||
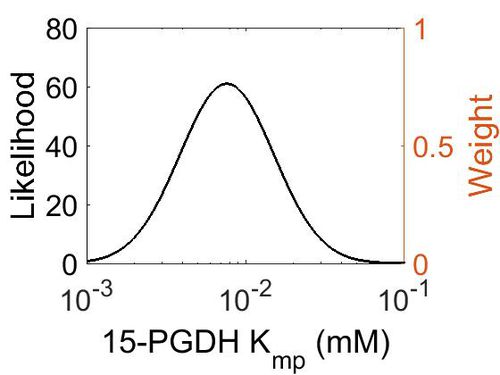
| + | | 7.70E-03 || -4.41E+00 || 6.72E-01 | ||
| + | |} | ||
| + | |||
| + | [[Image:74.jpg|none|thumb|500px|The estimated probability distribution for 15-PGDH Kmp. The value and weight of the literature values used to define the distribution are indicated by an orange dashed line. The x axis is plotted on a log-scale. ]] | ||
| + | |||
| + | ===k<sub>cat</sub>=== | ||
{|class="wikitable sortable" | {|class="wikitable sortable" | ||
| − | |+ style="text-align: left;" | | + | |+ style="text-align: left;" | Literature values |
|- | |- | ||
! Value | ! Value | ||
| Line 128: | Line 146: | ||
|} | |} | ||
| + | {| class="wikitable" | ||
| + | |+ style="text-align: left;" | Description of the 15-PGDH kcat distribution | ||
| + | ! Mode (min-1) !! Confidence Interval !! Location parameter (μ) !! Scale parameter (σ) | ||
| + | |- | ||
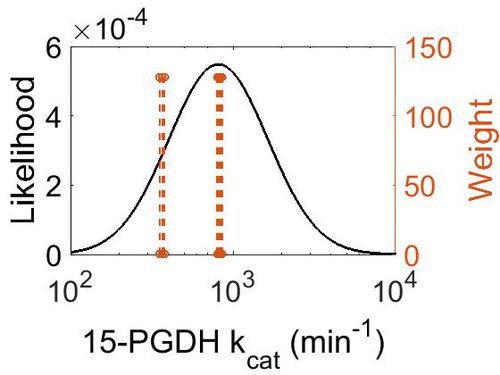
| + | | 8.12E+02 || 5.38E+00 || 7.19E+00 || 7.01E-01 | ||
| + | |} | ||
| + | |||
| + | [[Image:75.jpg|none|thumb|500px|The estimated probability distribution for 15-PGDH kcat. The value and weight of the literature values used to define the distribution are indicated by an orange dashed line. The x axis is plotted on a log-scale. ]] | ||
| + | |||
| + | ===Enzyme concentration === | ||
{|class="wikitable sortable" | {|class="wikitable sortable" | ||
| − | |+ style="text-align: left;" | | + | |+ style="text-align: left;" | Literature values |
|- | |- | ||
! Value | ! Value | ||
| Line 174: | Line 202: | ||
|} | |} | ||
| + | {| class="wikitable" | ||
| + | |+ style="text-align: left;" | Description of the 15-PGDH concentration distribution | ||
| + | ! Mode (mM) !! Confidence Interval !! Location parameter (μ) !! Scale parameter (σ) | ||
| + | |- | ||
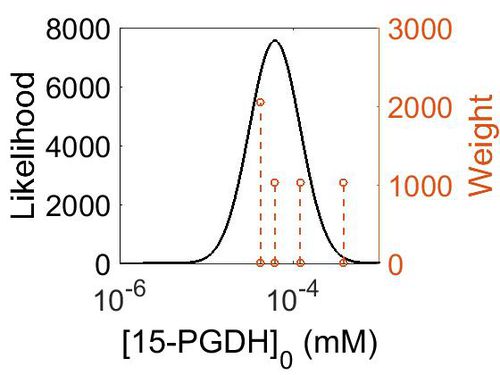
| + | | 1.12E+01 || 2.32E+00 || 2.87E+00 || 6.80E-01 | ||
| + | |} | ||
| + | |||
| + | [[Image:152.jpg|none|thumb|500px|The estimated probability distribution for 15-PGDH concentration. The value and weight of the literature values used to define the distribution are indicated by an orange dashed line. The x axis is plotted on a log-scale. ]] | ||
| + | |||
| + | ===K<sub>eq</sub>=== | ||
{|class="wikitable sortable" | {|class="wikitable sortable" | ||
|+ style="text-align: left;" | Gibbs Free Energy Change | |+ style="text-align: left;" | Gibbs Free Energy Change | ||
| Line 194: | Line 232: | ||
|<ref name="MetaCyc”>[http://metacyc.org/META/NEW-IMAGE?type=REACTION&object=ARACHIDONATE-12-LIPOXYGENASE-RXN Caspi et al 2014, "The MetaCyc database of metabolic pathways and enzymes and the BioCyc collection of Pathway/Genome Databases," Nucleic Acids Research 42:D459-D471]</ref> | |<ref name="MetaCyc”>[http://metacyc.org/META/NEW-IMAGE?type=REACTION&object=ARACHIDONATE-12-LIPOXYGENASE-RXN Caspi et al 2014, "The MetaCyc database of metabolic pathways and enzymes and the BioCyc collection of Pathway/Genome Databases," Nucleic Acids Research 42:D459-D471]</ref> | ||
|} | |} | ||
| + | |||
| + | {| class="wikitable" | ||
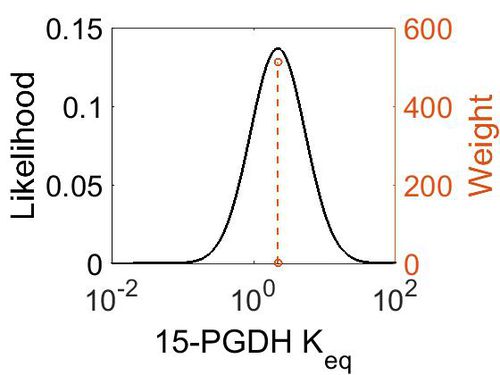
| + | |+ style="text-align: left;" | Description of the 15-PGDH Keq distribution | ||
| + | ! Mode !! Confidence Interval !! Location parameter (μ) !! Scale parameter (σ) | ||
| + | |- | ||
| + | | 2.21E+00 || 1.00E+01 || 1.58E+00 || 8.91E-01 | ||
| + | |} | ||
| + | |||
| + | [[Image:76.jpg|none|thumb|500px|The estimated probability distribution for 15-PGDH Keq. The value and weight of the literature values used to define the distribution are indicated by an orange dashed line. The x axis is plotted on a log-scale. ]] | ||
== References == | == References == | ||
<references/> | <references/> | ||
Revision as of 12:57, 16 May 2019
15-hydroxyprostaglandin dehydrogenase, also known as (15-PGDH) metabolises PG into the 15-Keto variant via the oxidation of 15(S)-hydroxyl group. The enzyme is constituently expressed in the skin (Finhelm1982) and within the eicosanoid network it is reported as metabolising PGE2 and PGF2a.
It should be noted that Judson et al found that 15-PGDH expression of the enzyme decreases in response to UVR (Judson2010).
Contents
Reaction
Catalysed by 15-PGDH
Chemical equation

Rate equation
Enzyme Parameters
Kms
| Value | Units | Species | Notes | Reference |
|---|---|---|---|---|
| 0.008 | 
|
Rat Skin | Method:
pH:7.4 Temperature: 37'C Substrate: PGE2 + NAD+ |
[1] |
| 0.0075 | 
|
Rat Skin | Method:
pH:7.4 Temperature: 37'C Substrate: PGE2 + NADP+ |
[1] |
| 0.024 | 
|
Rat Skin | Method:
pH:7.4 Temperature: 37'C Substrate: PGF2a + NAD+ |
[1] |
| 0.023 | 
|
Rat Skin | Method:
pH:7.4 Temperature: 37'C Substrate: PGF2a + NADP+ |
[1] |
| 0.0039 | 
|
Purified Human 15-PGDH | Method: In vitro
Expression Vector: E. coli pH:7.5 Temperature: 37'C Substrate: PGE2 |
[2] |
| 0.0099 | 
|
Purified Rat 15-PGDH | Method: In vitro
Expression Vector: E. coli pH:7.5 Temperature: 37'C Substrate: PGE2 |
[2] |
| 0.0055 ± 0.0006 | 
|
Human | Method:In vitro
Expression Vector: E. Coli pH:8 Temperature: 25 Substrate: PGE2 + NAD+ |
[3] |
| Mode (mM) | Confidence Interval | Location parameter (μ) | Scale parameter (σ) |
|---|---|---|---|
| 7.64E-03 | 5.05E+00 | -4.41E+00 | 6.80E-01 |
Kmp
| Mode (mM) | Location parameter (μ) | Scale parameter (σ) |
|---|---|---|
| 7.70E-03 | -4.41E+00 | 6.72E-01 |
kcat
| Value | Units | Species | Notes | Reference |
|---|---|---|---|---|
| 816 ± 18 | 
|
Human | Method: In vitro
Expression Vector: E. Coli pH:8 Temperature: 25 Substrate: PGE2 + NAD+ |
[3] |
| 366 ± 12 - 846 ± 12 | 
|
Human | Method: In vitro
Expression Vector: E. Coli pH:8 Temperature: 25 Substrate: PGE2 + NAD+ + Inhibitor |
[3] |
| Mode (min-1) | Confidence Interval | Location parameter (μ) | Scale parameter (σ) |
|---|---|---|---|
| 8.12E+02 | 5.38E+00 | 7.19E+00 | 7.01E-01 |
Enzyme concentration
| Value | Units | Species | Notes | Reference |
|---|---|---|---|---|
| 69.8 | 
|
Human | Expression Vector: Esophagus
Enzyme: 15-PGDH pH: 7.5 Temperature: 37 °C |
[4] |
| 22.1 | 
|
Human | Expression Vector: Heart
Enzyme: 15-PGDH pH: 7.5 Temperature: 37 °C |
[5] |
| 11.2 | 
|
Human | Expression Vector: Esophagus
Enzyme: 15-PGDH pH: 7.5 Temperature: 37 °C |
[5] |
| 7.68 | 
|
Human | Expression Vector: Skin
Enzyme: 15-PGDH pH: 7.5 Temperature: 37 °C |
Paxdb - Unknown |
| Mode (mM) | Confidence Interval | Location parameter (μ) | Scale parameter (σ) |
|---|---|---|---|
| 1.12E+01 | 2.32E+00 | 2.87E+00 | 6.80E-01 |
Keq
| Value | Units | Species | Notes | Reference |
|---|---|---|---|---|
| (-0.46818542) | kcal/mol | Calculated | Estimated
Enzyme: 15-PGDH Substrate: PGE2 Product: 15-dehydro-PGE2 pH: 7.3 ionic strength: 0.25 |
[6] |
| Mode | Confidence Interval | Location parameter (μ) | Scale parameter (σ) |
|---|---|---|---|
| 2.21E+00 | 1.00E+01 | 1.58E+00 | 8.91E-01 |
References
- ↑ 1.0 1.1 1.2 1.3 N. Fincham, Novel prostaglandin dehydrogenase in rat skin. Biochem J. 1983 Apr 15;212(1):129-34.
- ↑ 2.0 2.1 Zhou H., C-Terminal region of human NAD+-dependent 15-hydroxyprostaglandin dehydrogenase is involved in the interaction with prostaglandin substrates. Eur J Biochem. 2001 Jun;268(12):3368-74.
- ↑ 3.0 3.1 3.2 F. Niesen,, High-Affinity Inhibitors of Human NAD+-Dependent 15-Hydroxyprostaglandin Dehydrogenase: Mechanisms of Inhibition and Structure-Activity Relationships PLoS One. 2010 Nov 2;5(11):e13719.
- ↑ M. Wilhelm Mass-spectrometry-based draft of the human proteome Nature, 2014 509, 582–587
- ↑ 5.0 5.1 M. Kim A draft map of the human proteome Nature, 2014 509, 575–581
- ↑ Caspi et al 2014, "The MetaCyc database of metabolic pathways and enzymes and the BioCyc collection of Pathway/Genome Databases," Nucleic Acids Research 42:D459-D471

