Degradation of r-a
The mRNA complex of scbR-scbA degrades very soon after its formation.


Contents
Chemical equation

Rate equation
![r= d_{mRA}\cdot[r-a]](/wiki/images/math/9/a/5/9a53eca246db7073ce49f58c1edf7616.png)
Parameters
The parameter of this reaction is the degradation rate of the r-a complex  .
.
| Name | Value | Units | Value in previous GBL model [1] | Remarks-Reference |
|---|---|---|---|---|
|
|
 [2] [3] [2] [3]
|

|
 [1] [1]
Bistability range: ( |
In a study on the properties of antisense RNA and on the effect it has on gene regulation in bacteria, Georg et al. report that the antisense RNAs resulting from overlapping or divergent promoters (i.e. isiA/IsrR sense/antisense pair in Synechocystis PCC6803) that form a complex, co-degrade almost immediately.
Georg et al. 2012[3] This opinion is further supported by A.J. Carpousis who, in a review on gene regulation by antisense RNA and quantifies a short mRNA half-life as approximately  A.J. Carpousis 2003[2] Therefore we can assume that the antisense RNA in the GBL system will follow a similar pattern and will rapidly degrade. The half-life should be kept under |

 )
)
 .
.
 . From the antisense RNA half-life (
 ) we calculated the degradation rate, as per
 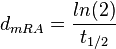 , which resulted in a degradation rate constant value between
  .
.
Parameters with uncertainty
When deciding how to describe the uncertainty for this parameter we must take into consideration that the reported values are either calculated with approximation from experiments corresponding to different antisense RNA degradation rates of various bacteria species and are mostly a quantification of our understanding of immediate degradation. This means that there might be a difference between the actual parameter values and the ones reported in literature, although the reported values in literature suggest that the upper bound for the half-life of such a complex would not exceed 2 minutes. These facts influence the quantification of the parameter uncertainty and therefore the shape of the corresponding distribution. By assigning the appropriate weights to the parameter values and using the method described here, the appropriate probability distribution was designed.
Therefore, in order to keep the parameter values as strictly as possible within the range of the values reported in literature, the prediction interval in this case for the definition of the distribution is set to 95.45% rather than 68.27%. Therefore, the mode of the log-normal distribution of the is set to  and the Spread is set to
  , which means that the range where 95.45% of the values are found is between
  and
and  .
.
The probability distribution for the parameter, adjusted accordingly in order to reflect the above values, is the following:

The values retrieved from literature and their weights are indicated by the blue dashed lines, and the uncertainty for each value is indicated using a default value of 10% error (orange lines).
The parameter information of the distribution is:
| Parameter | Mode | Spread | μ | σ |
|---|---|---|---|---|
|
|

|
|

|

|
References
- ↑ 1.0 1.1 A. Chatterjee, L. Drews, S. Mehra, E. Takano, Y.N. Kaznessis, and W.-S. Hu. Convergent transcription in the butyrolactone regulon in streptomyces coelicolor confers a bistable genetic switch for antibiotic biosynthesis. PLoS ONE, 6(7), 2011.
- ↑ 2.0 2.1 Carpousis A.J. Degradation of targeted mRNAs in Escherichia coli: regulation by a small antisense RNA. Genes & Dev. 2003. 17: 2351-2355.
- ↑ 3.0 3.1 Georg J., Hess WR. Cis-antisense RNA, another level of gene regulation in bacteria. Microbiol Mol Biol Rev. 2011;75(2):286-300.